Your first project
Install and set up PyneIDE, create a project, and run your first program.
The book’s first program plots the candles’ closing prices. To build it, you install PyneIDE, create a project folder, and run the program on sample data.
The next chapter explains the code line by line. Here, you first get familiar with the editor and running a program.
What will you need?
A computer that can run Visual Studio Code, plus an internet connection for the initial installation of PyneIDE and its runtime. PyneIDE works with Visual Studio Code 1.90 or newer.
The entire learning process is free. You can install and use the Visual Studio Code editor, the PyneIDE extension, and the PyneCore runtime for free. Writing and running the book’s examples is free too.
You do not need a PyneSys account, an API key, or a paid subscription. Pyne code runs locally on your computer, and we practice with the sample data provided for the book.
Install PyneIDE
- If Visual Studio Code is not installed on your computer, install it from the official website.
- Start Visual Studio Code and open View → Extensions. Here you can search for extensions on the official Visual Studio Code Marketplace.
- Enter
PyneIDEin the search field. Select the PyneIDE extension published by PyneSys. - Click Install and wait for installation to finish.
- If the editor asks you to reload, choose Reload.
Create a project
A project is a folder where you keep programs, data, and results together. Create an empty folder called pyne-book, then open it with File → Open Folder….
You can create the project from PyneIDE’s own menu:
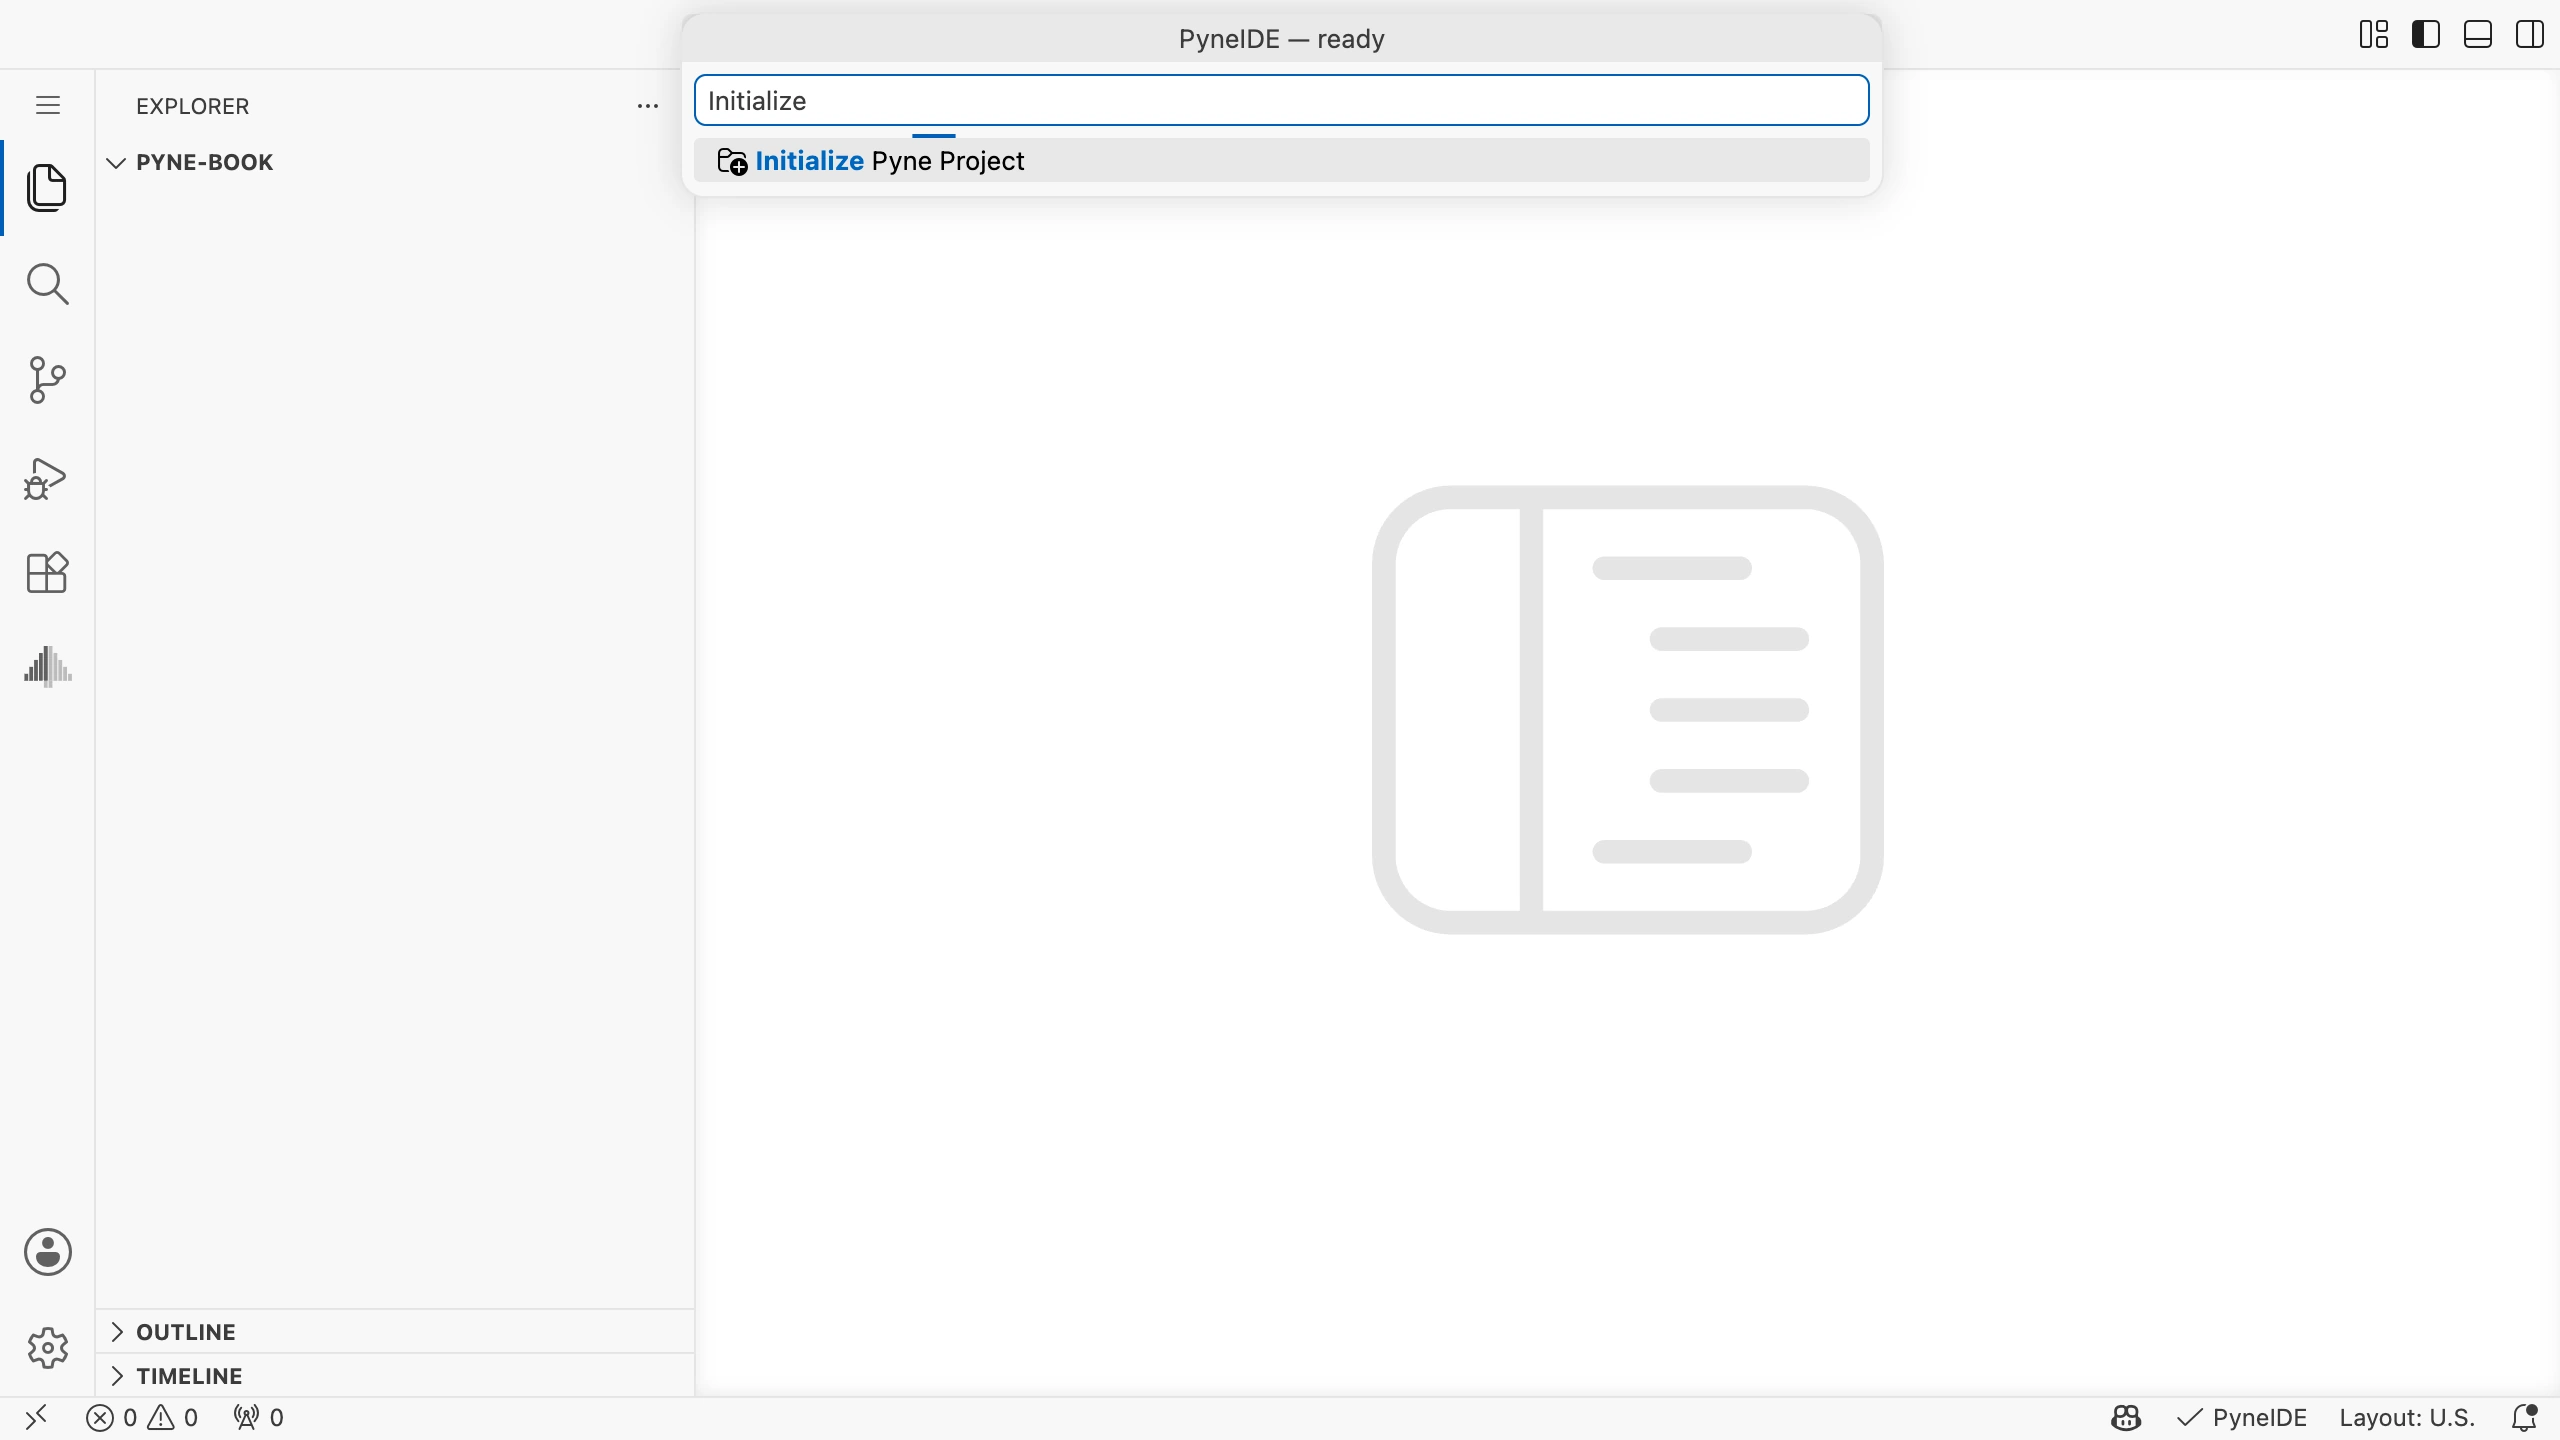
- Click PyneIDE in the status bar at the bottom right of the window. This opens the menu of PyneIDE actions.
- Type
Initializein the search field at the top of the menu. This makes the project creation action easy to find. - Click Initialize Pyne Project. This starts creating the project folders and sample files.
The first time, PyneIDE offers to set up the runtime. Click Setup Now in the notification and wait for it to finish. This installs the required Python and PyneCore in the extension’s own environment. If you dismissed the notification earlier, click PyneIDE at the bottom right again, then Setup Environment in the menu.
If PyneIDE asks where to put the folder structure, choose Use this folder. The project will then be created directly inside the open folder.
The Pyne view appears in the icon bar on the left. Open it to find your project’s programs and data.
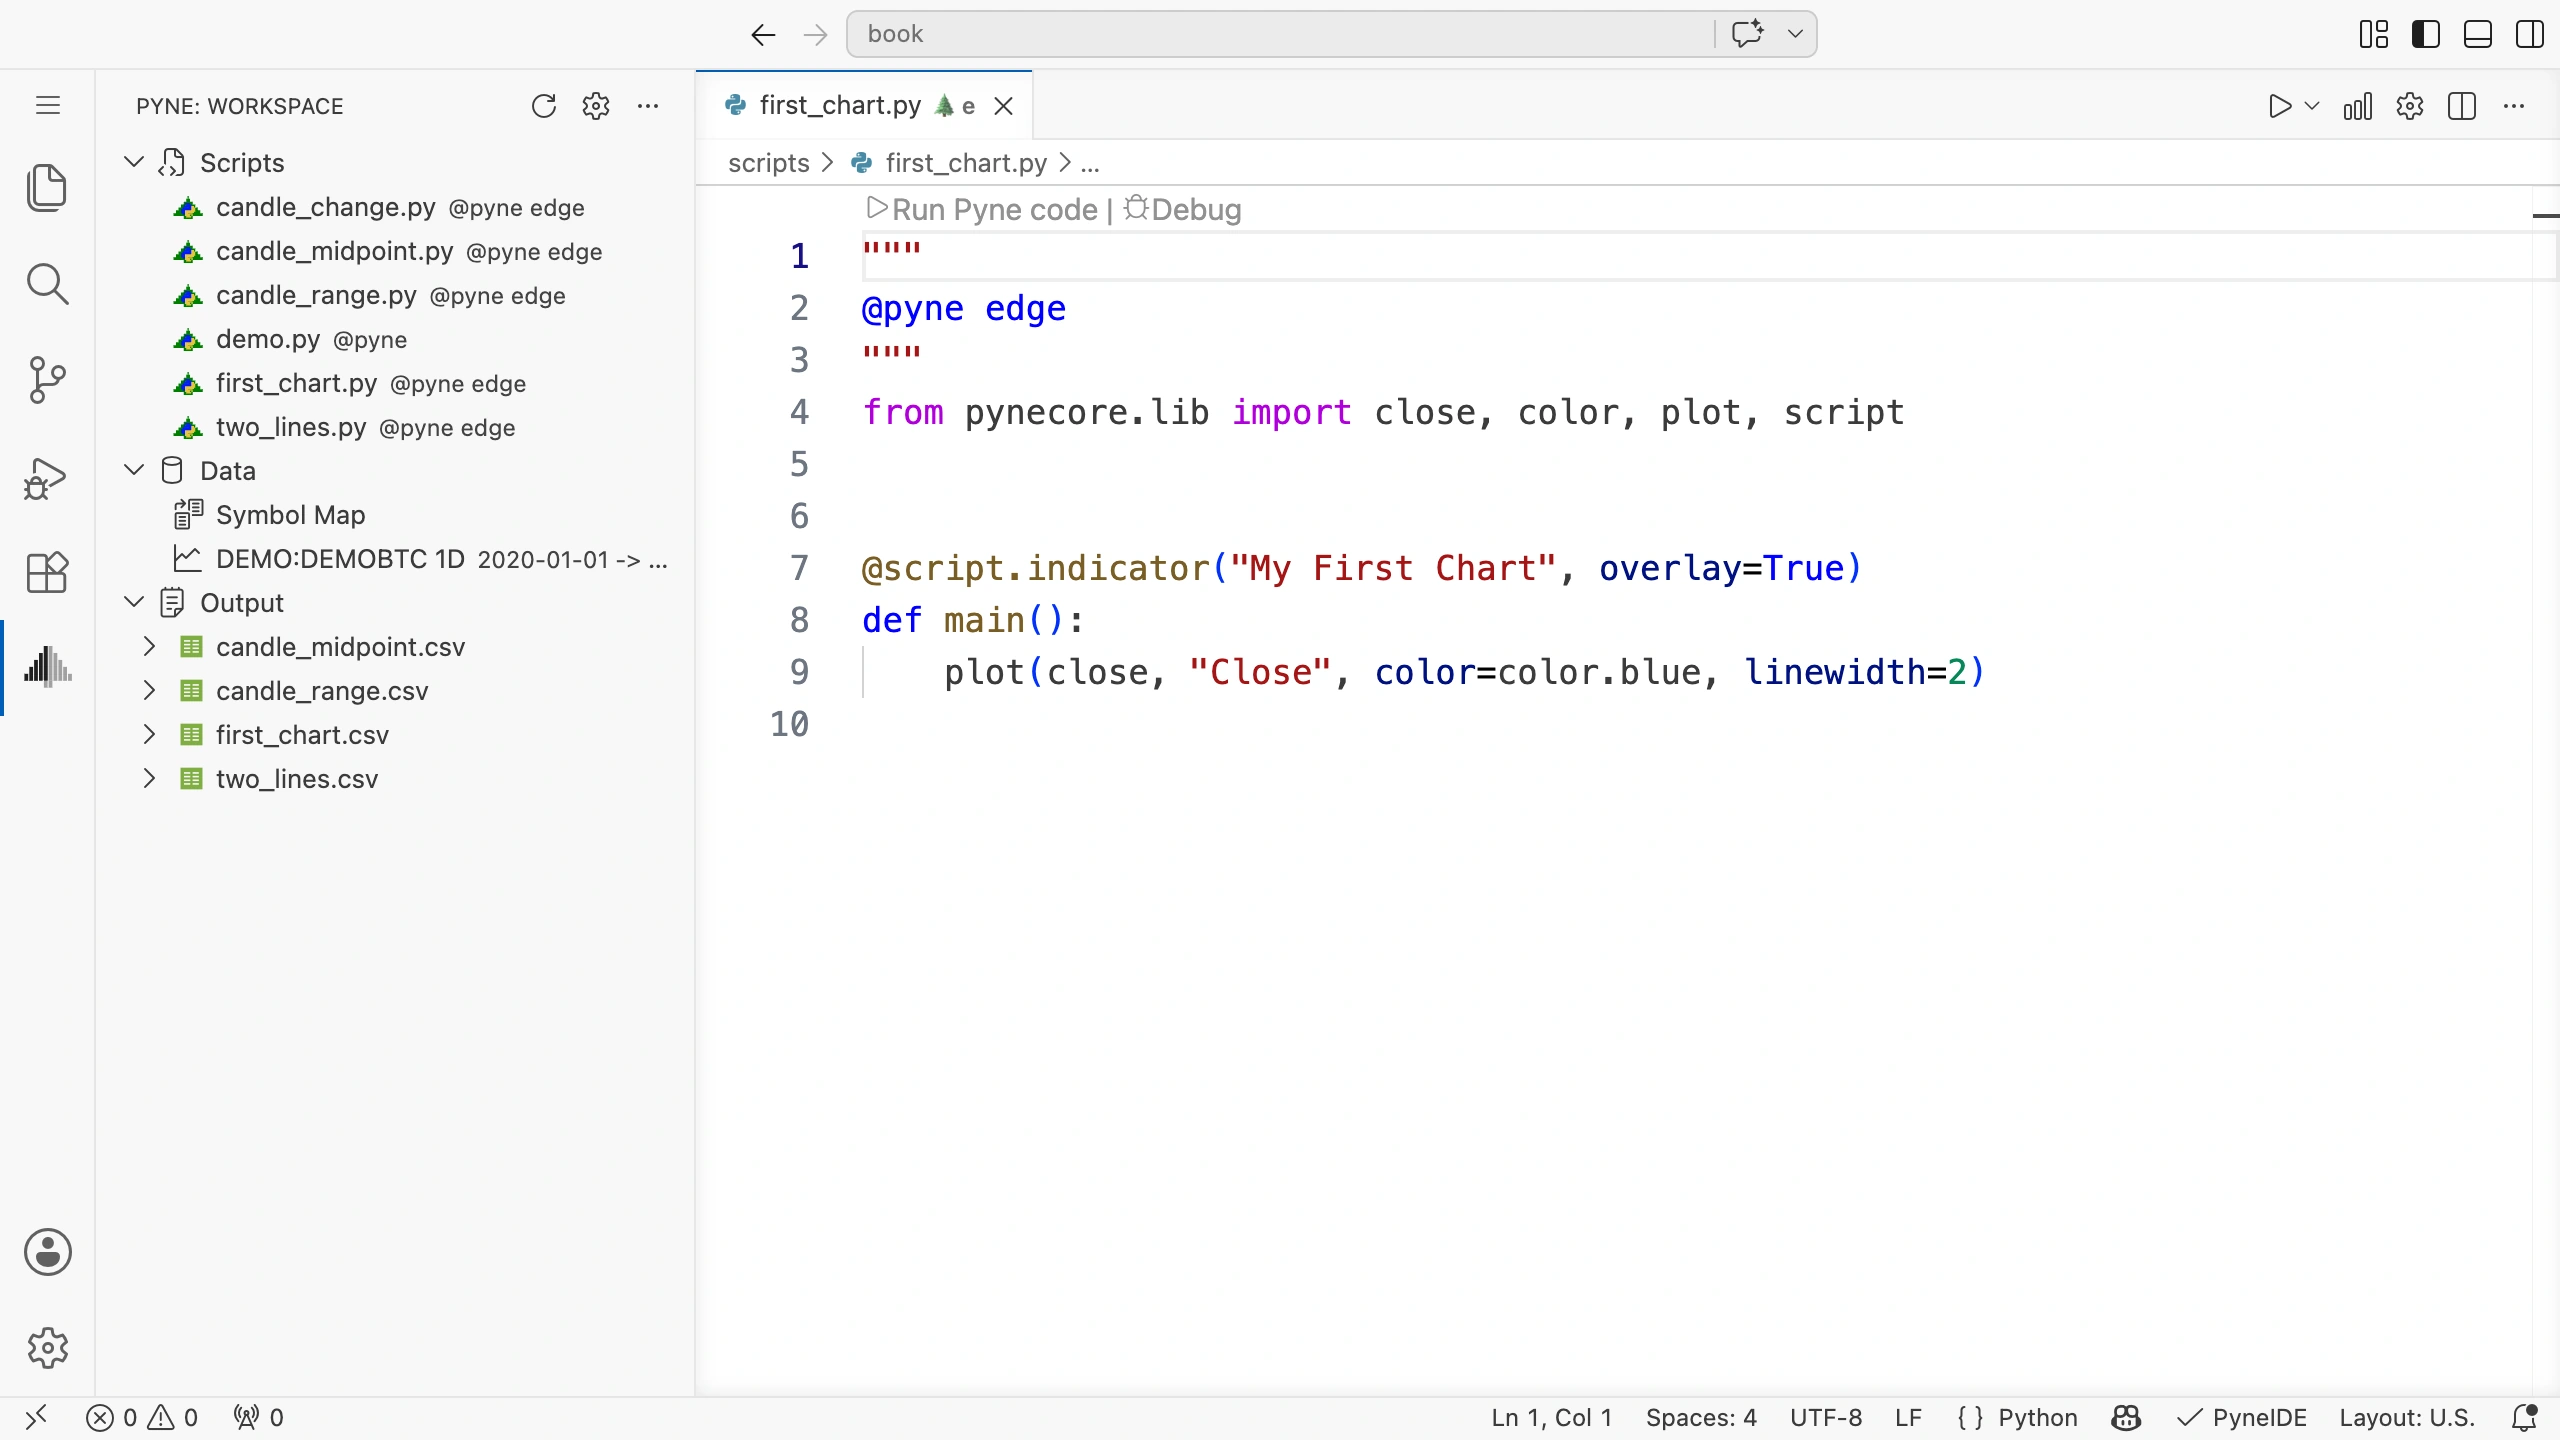
What is in the folder?
- The
scriptsfolder holds your programs. Pyne code files have the.pyextension. - The
datafolder holds the data to process. The generateddemo.ohlcvis sample data for learning. - The
outputfolder receives the results of runs. - The
configfolder contains the project’s environment settings. You do not need to change it in this chapter.
.py? .py is the usual extension for Python files. Pyne code has Python syntax, so it can also be used in a Python runtime with PyneCore installed. PyneCore provides candle-by-candle execution and Pyne’s behavior; it needs both the program and the data to run it on. In this book, we start this with PyneIDE’s Run Pyne code action.The .ohlcv extension identifies a file that stores candle data. OHLCV stands for five values: open, high, low, close, and volume. We cover these in more detail in the chapter introducing candle data.
Write your first program
You can create your program directly in the Pyne view:
- Move the mouse pointer over the Scripts group row. A + button appears at its right edge.
- Click + to choose the type of new program.
- Click Pyne Indicator. We are creating an indicator written in Pyne code.
- Enter
first_chartin the name field and press Enter. PyneIDE automatically adds the.pyextension, createsscripts/first_chart.py, and opens it in the editor.
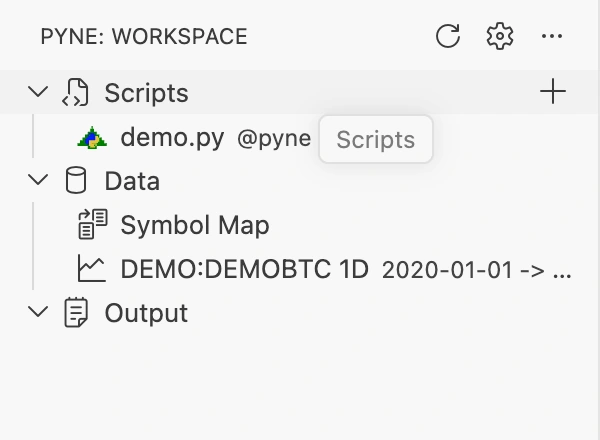
The file opens with an indicator template. Select its entire contents and replace them with the code below. The underscore joins two words in the filename; .py is the extension for the file with Python syntax.
scripts folder, click New File, and enter the full filename here: first_chart.py. The file will also appear in the Pyne view afterward.Copy in the following complete code, then save it:
"""
@pyne edge
"""
from pynecore.lib import close, color, plot, script

@script.indicator("My First Chart", overlay=True)
def main():
    plot(close, "Close", color=color.blue, linewidth=2)
The line below def main(): starts four spaces farther in. This indentation is part of the code. Preserve it when copying.
Run it
The Run Pyne code action appears above the code in the editor. Click it. If PyneIDE asks for data, choose the demo row labeled DEMOBTC @ 1D. This is the demo.ohlcv file.
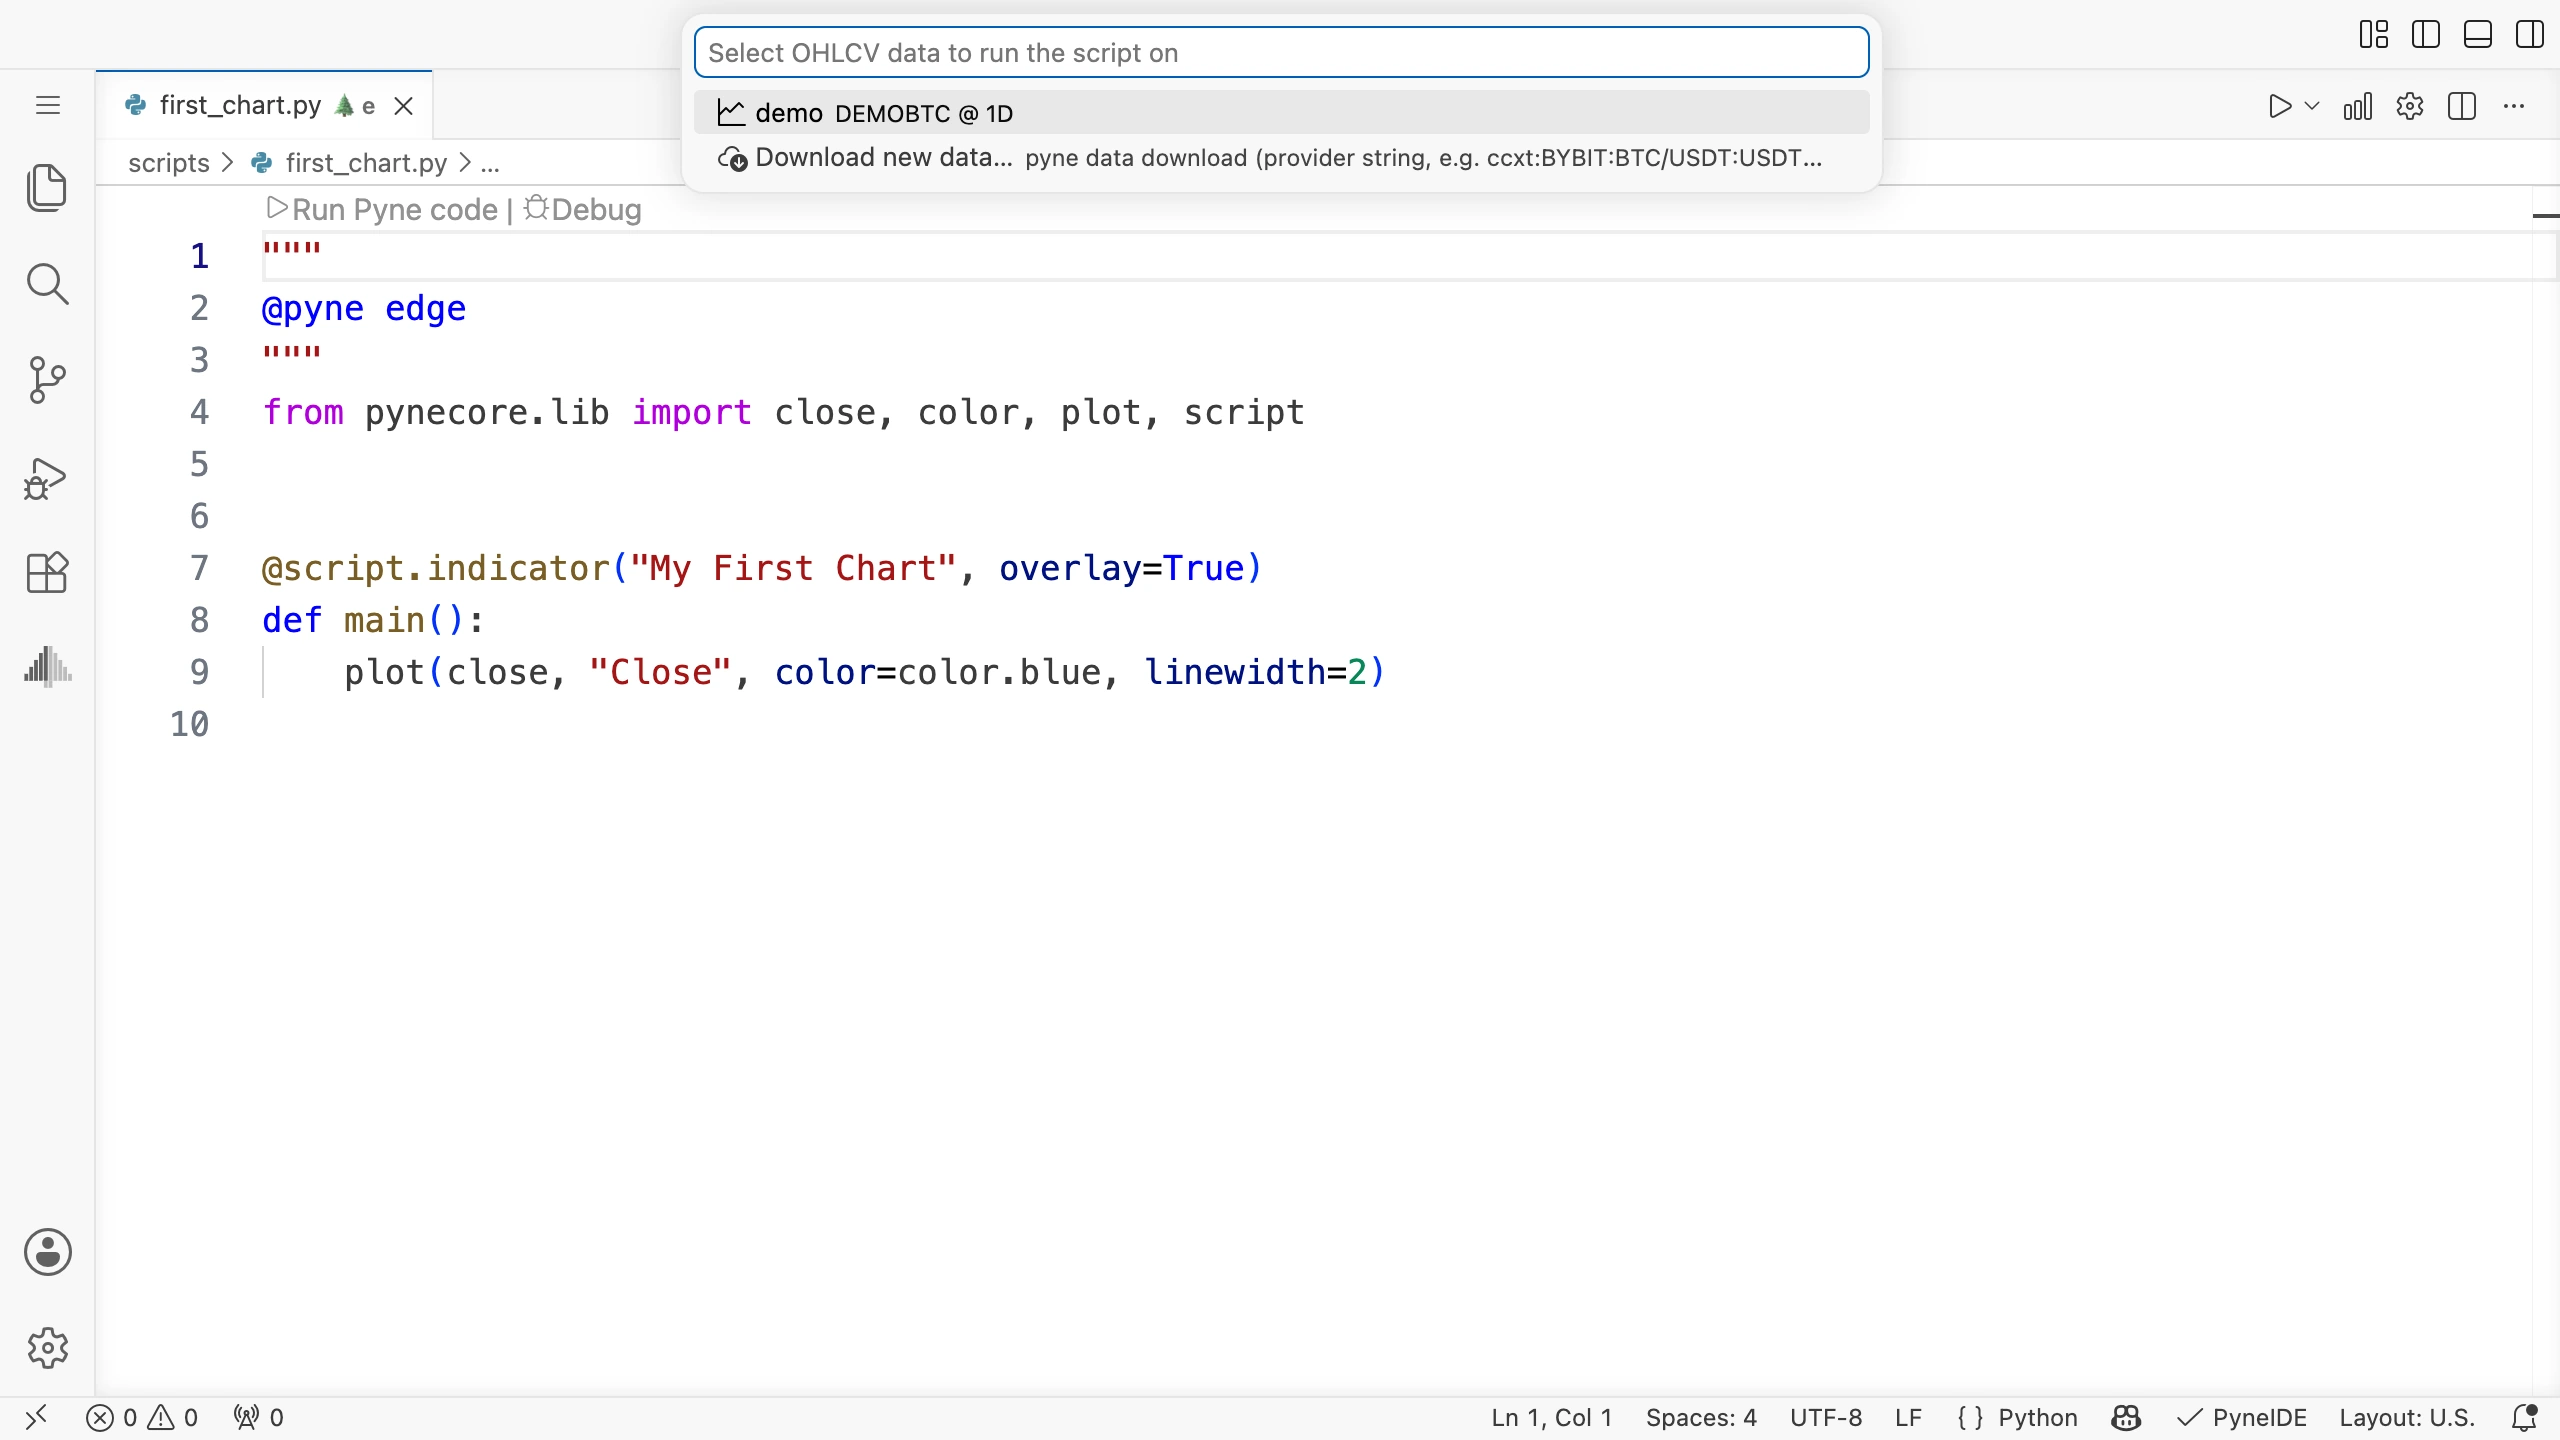
Selecting data tells the program which candles to process. This code always plots the closing prices of the selected data.
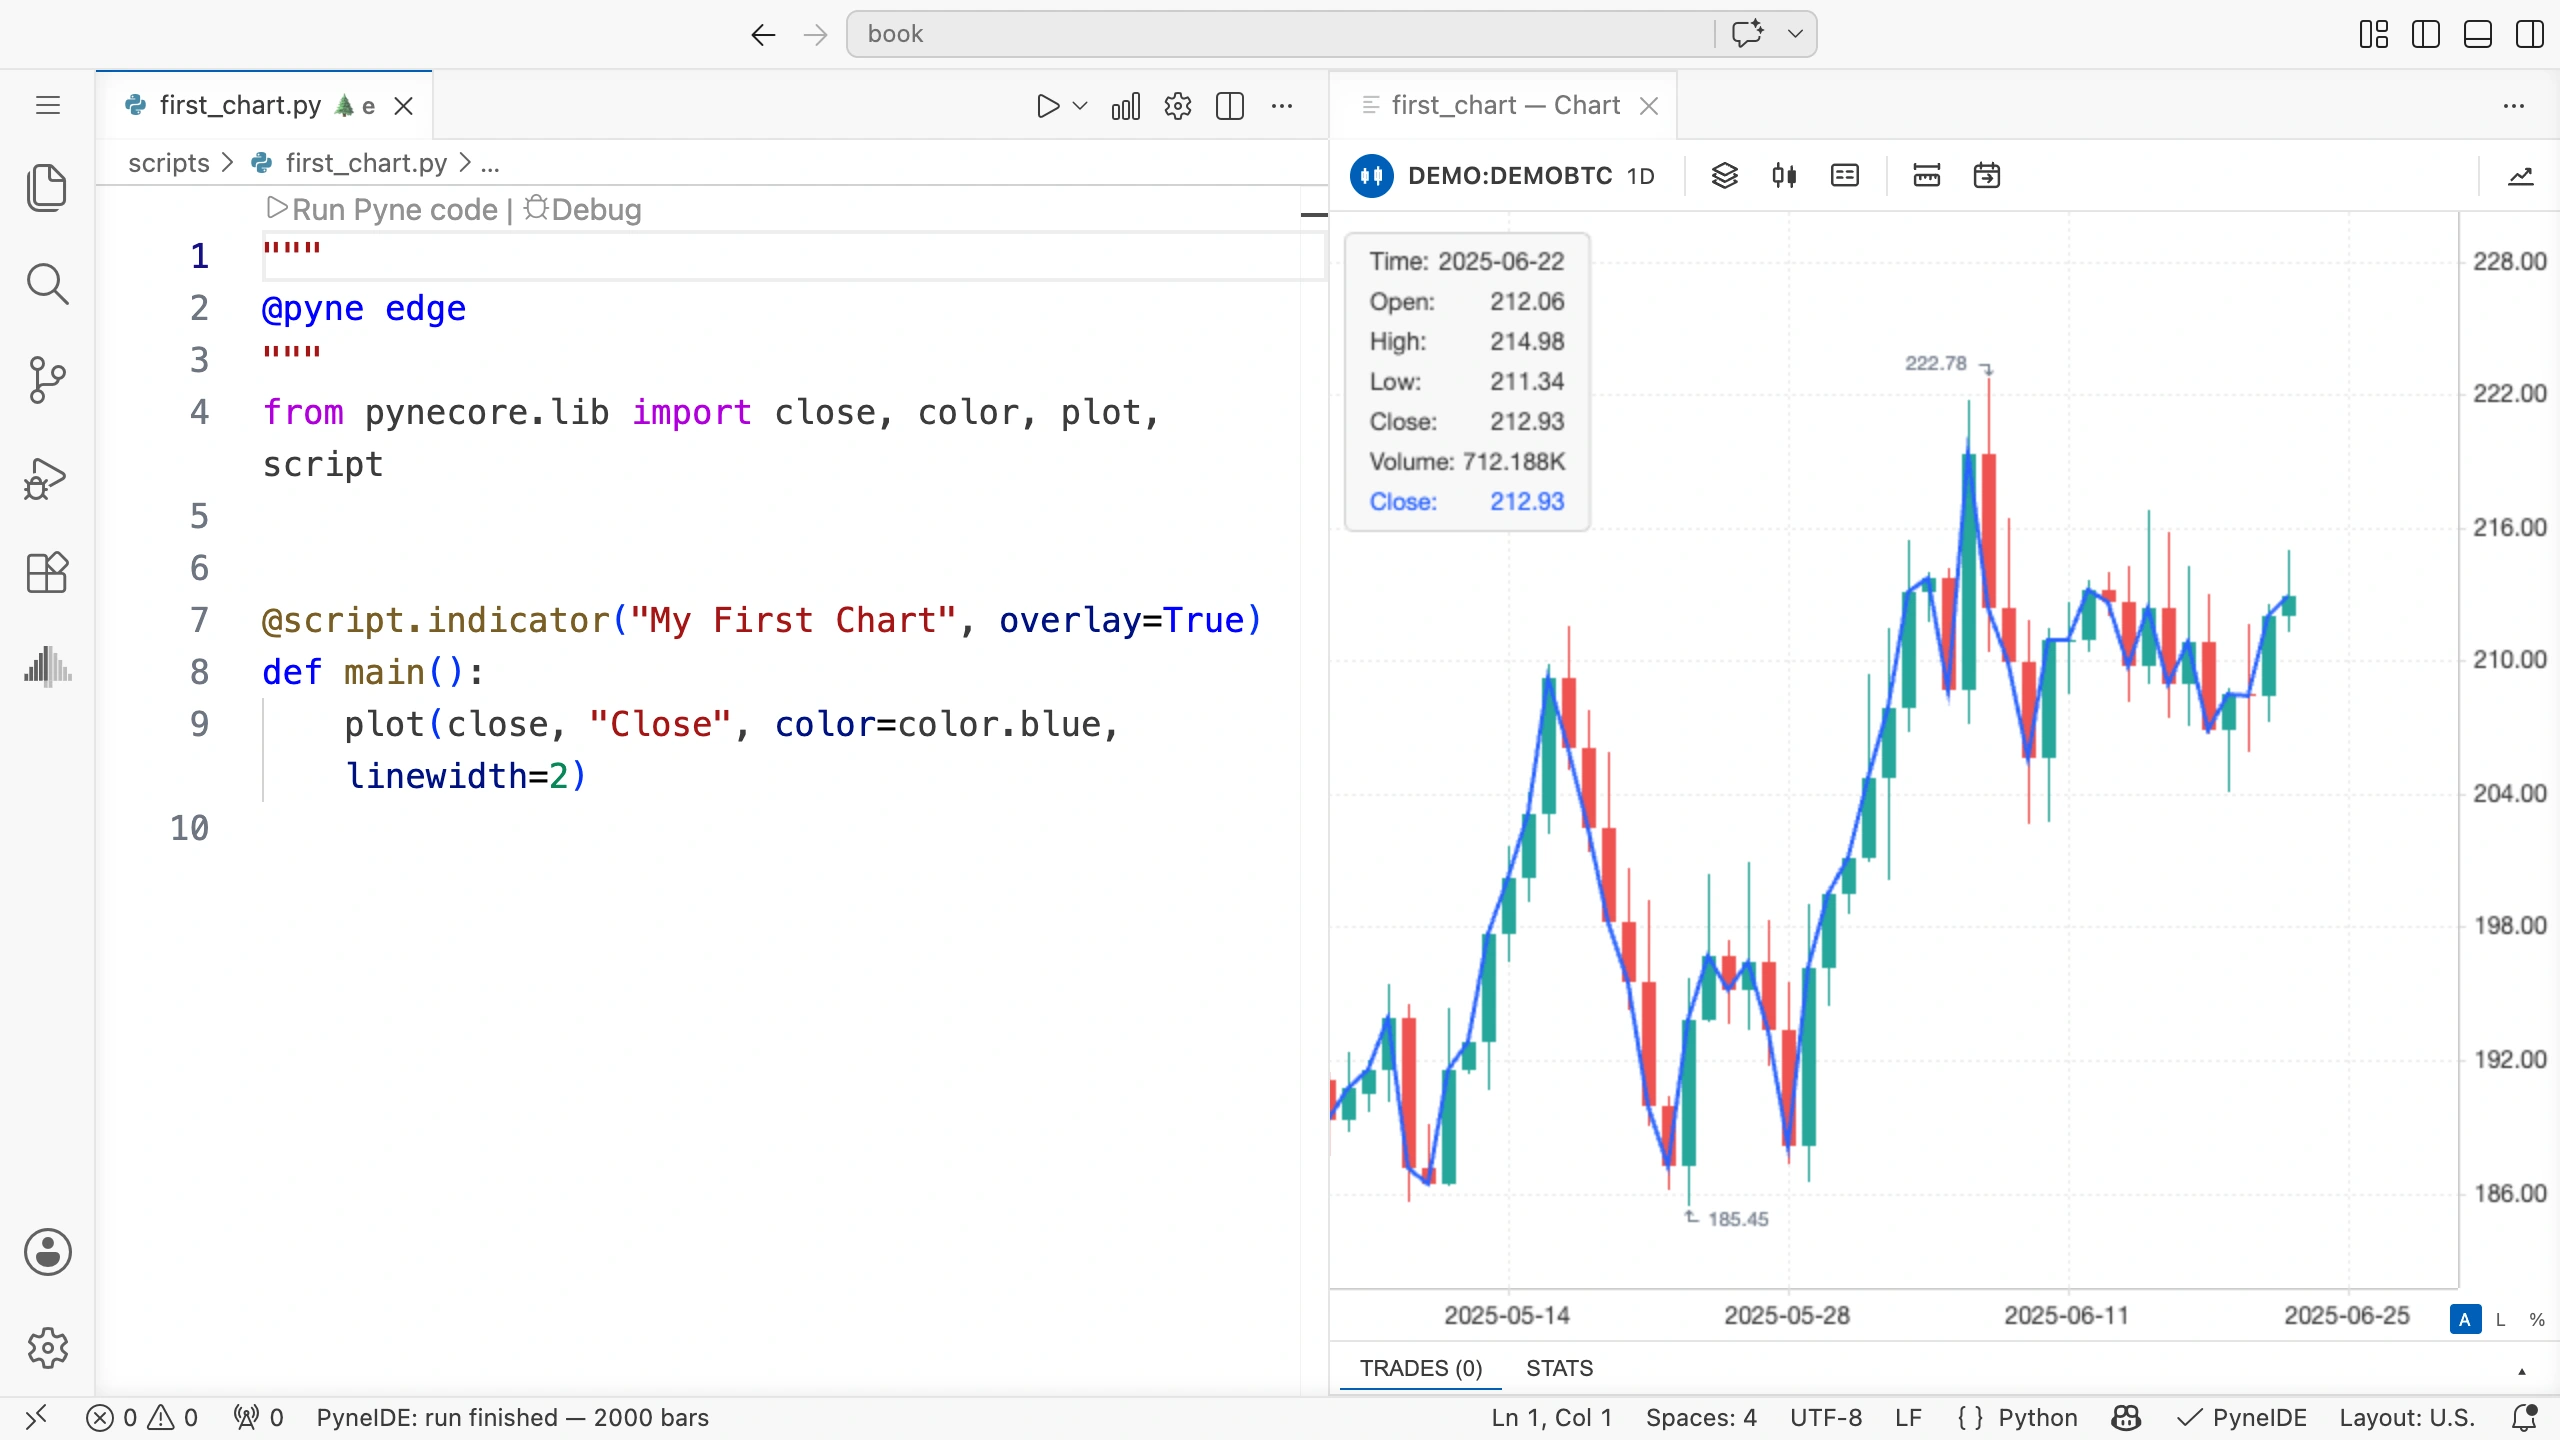
On the price chart, time moves from left to right. The blue line connects the closing prices of successive candles.
The screenshot uses the same demo data that PyneIDE creates when you create a project. You do not need to download or copy any separate data. Check that the blue line passes through each candle’s closing price.
If the chart did not appear
First look at the errors reported by the editor. Check the file’s location and extension, the first three lines of code, and the indentation of the plot line. If you typed the code by hand, try copying the complete example again.
If Run Pyne code does not appear, check that PyneIDE is installed and enabled, and that the start of the file matches the example exactly.
If the runtime has not been set up yet, open PyneIDE: Setup Environment. When running a program, finish selecting the data too: an open picker is waiting for another choice from you.
Try it yourself
Find "My First Chart" in the code and change it to:
"My Price Line"Before running it, think about what will change: the shape of the line or the program’s name?
Save the file and run it again with the same data.
Solution
The modified line:
@script.indicator("My Price Line", overlay=True)The program’s title changes. The calculation and data stay the same, so the line’s shape stays the same too.
Before you move on
If you reopen the project, can you find first_chart.py and run it on the sample data? Try without rereading the steps. If you get stuck, find the relevant section in this chapter.
In the next chapter, we examine this program line by line and plot the opening price alongside the closing price.