Help while writing code
View function parameters and documentation in PyneIDE and jump to their definitions.
You have already used the color and linewidth settings with the plot function. Later examples introduce more functions and parameters. You do not need to memorize all their names and order: PyneIDE displays help for them beside the code.
In this chapter, we use the first_chart.py file you have already created. You do not need to run the program now.
Hover over a function’s name
- Open
first_chart.pyfrom the Scripts group in the Pyne view. - Find the
plot(close, "Close", ...)call insidemain(). - Move the pointer over
plotat the start of the line and leave it there briefly.
The help popup shows the function’s parameter list and description. If the content is longer, move the pointer over the popup and scroll within it. Press Esc to close it.
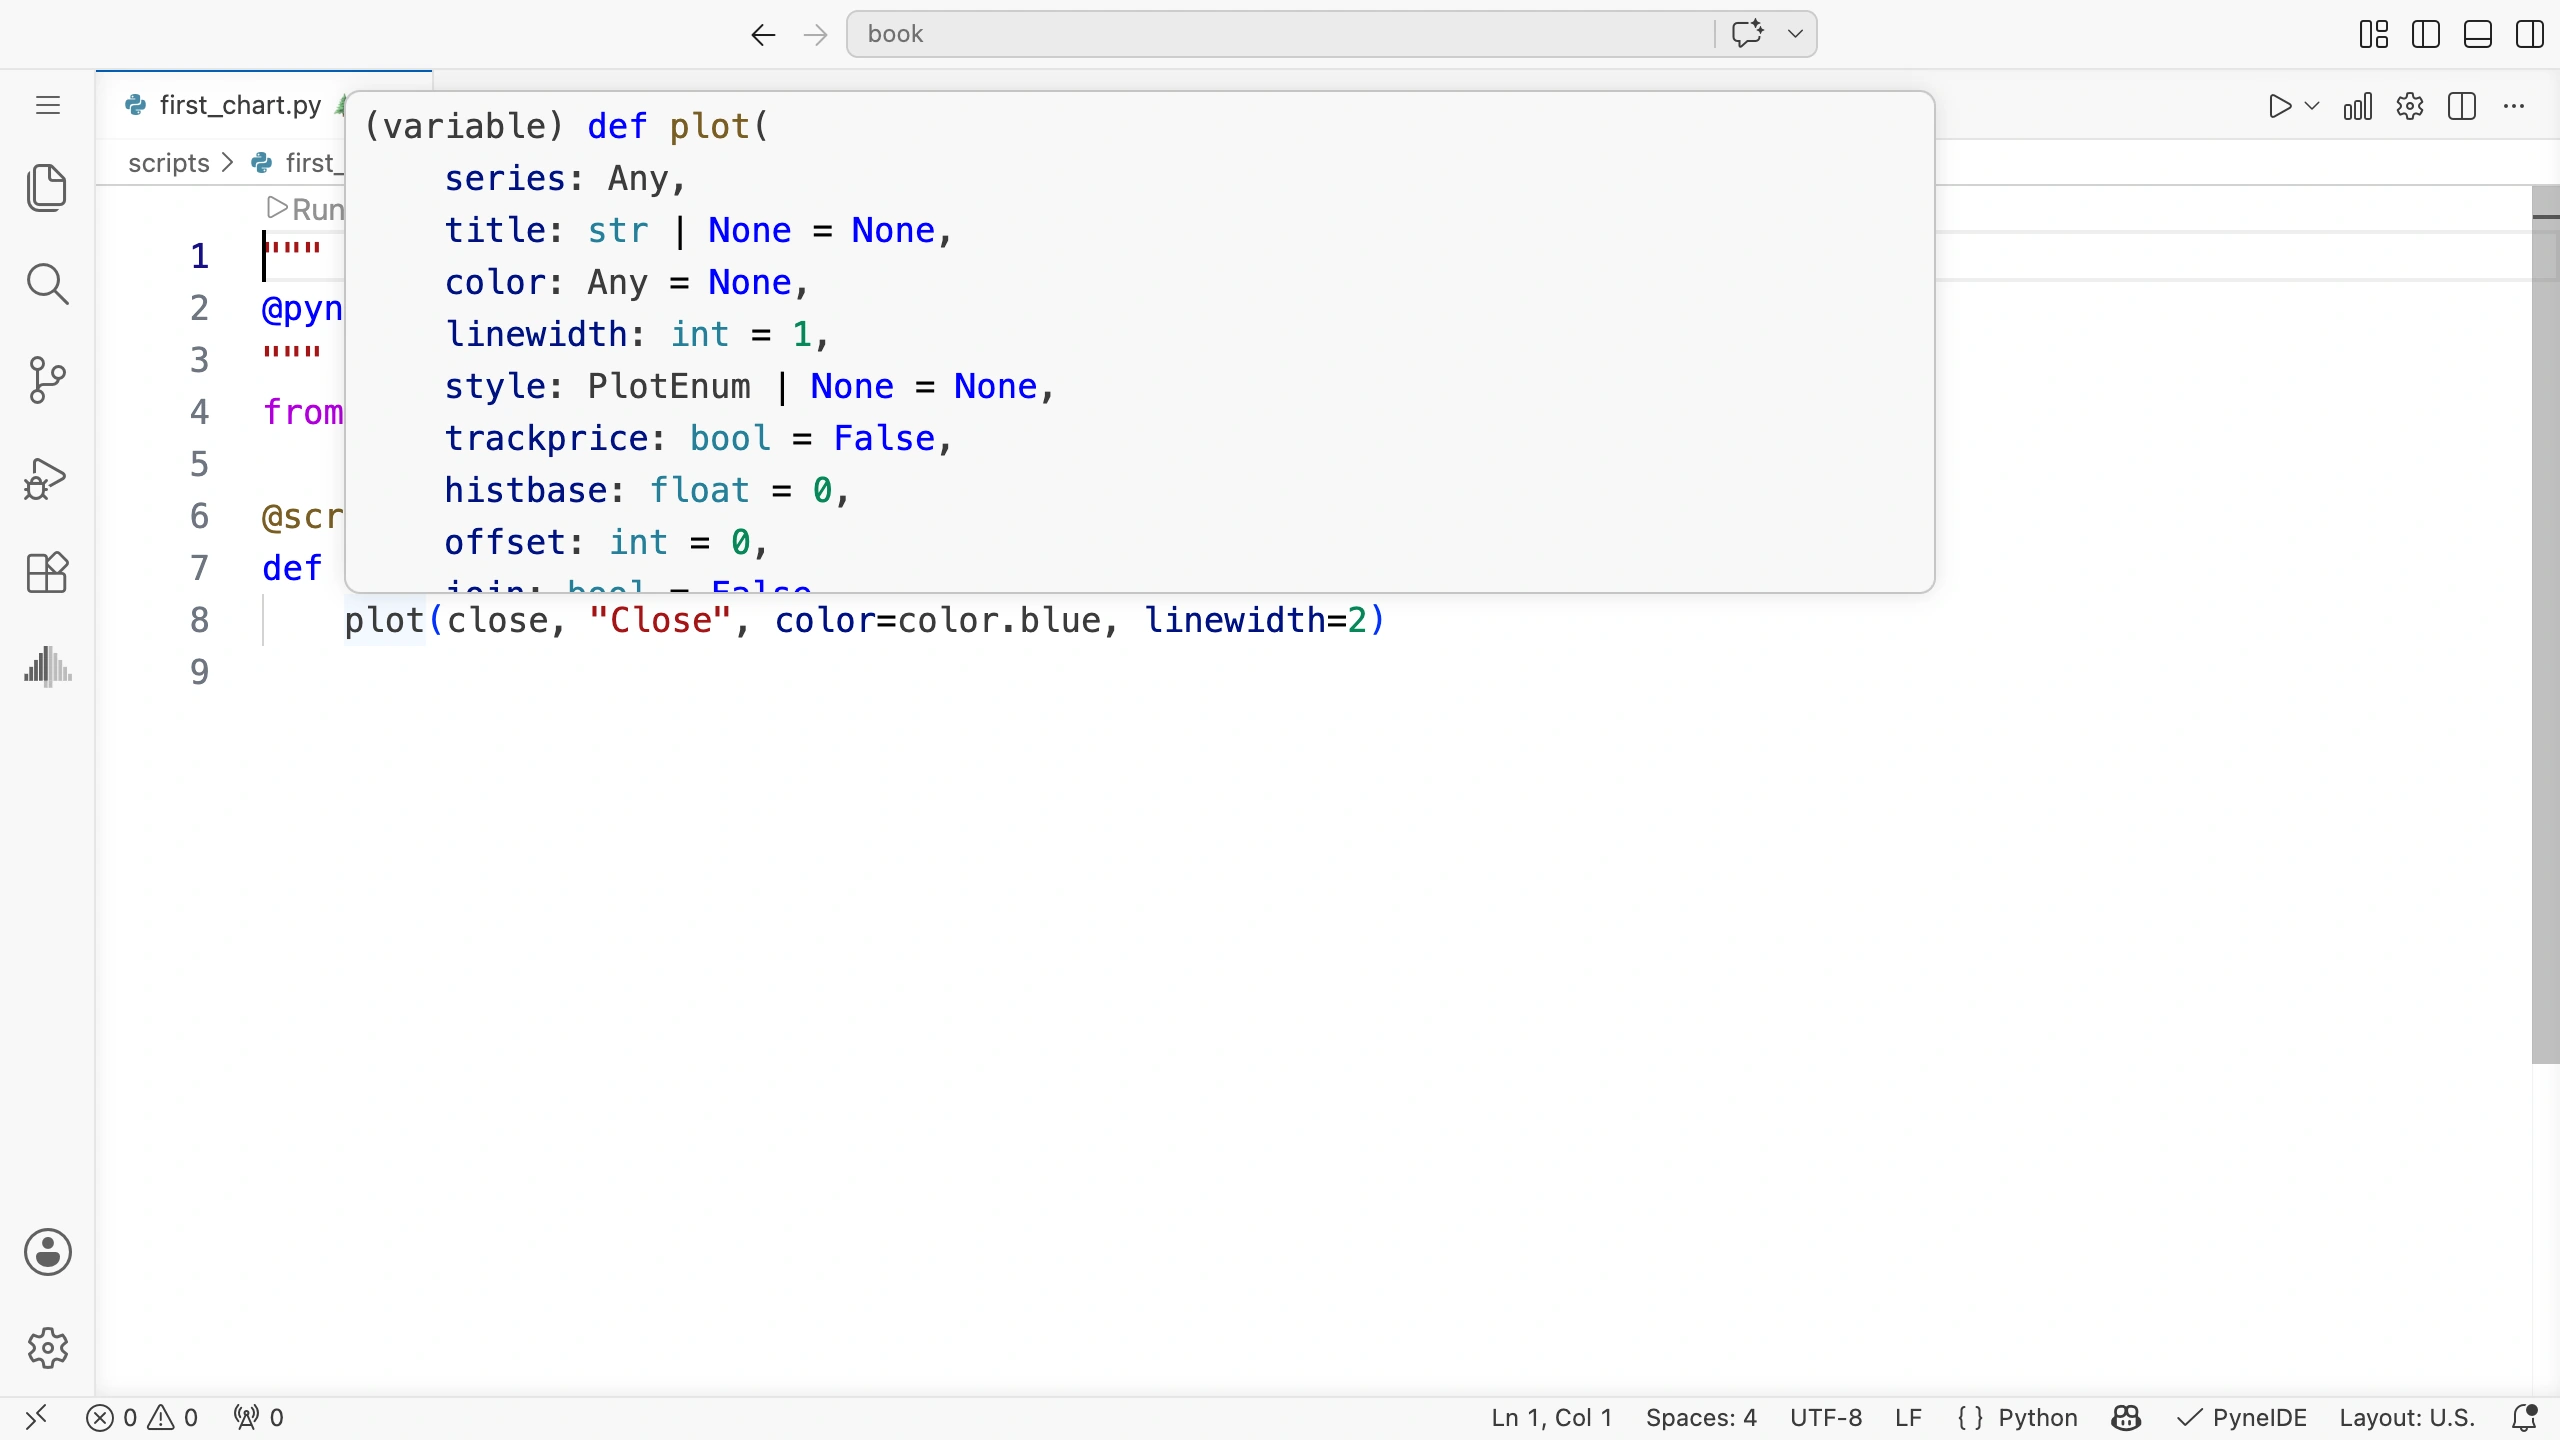
How to read the parameter list
The help may list more settings than we used in the example. You only need to find the ones you need at the moment.
For plot, for example:
seriesis the value to plot. In our program,closefills this position.titleis the plot’s name. The second argument in the call,"Close", supplies it.linewidthis the line’s width. The= 1in the parameter list is its default value; our example overrides it withlinewidth=2.
A parameter is the name of a value or setting a function expects. An argument is the value you pass to it in a call. So linewidth is a parameter, and the 2 passed in linewidth=2 is an argument.
If you also see a type beside a name, it tells you something about the expected value. For example, int means an integer. You encounter type annotations in the following chapters too; you do not need to learn the whole list now.
The help description and the explanations of the examples’ parameters are in English. When using a new function, it helps to scan the description first, then find the setting you want to change.
Another option: jump to the definition
To see where a function is written, hold Command on macOS or Ctrl on Windows or Linux and click plot. The editor opens its definition. You can also right-click the name and select Go to Definition.
In the file that opens, the function’s description and implementation follow the def plot(...) line. This is the installed library’s code: reading it is enough for this exercise; do not change it. Return to your own program by clicking the first_chart.py tab.
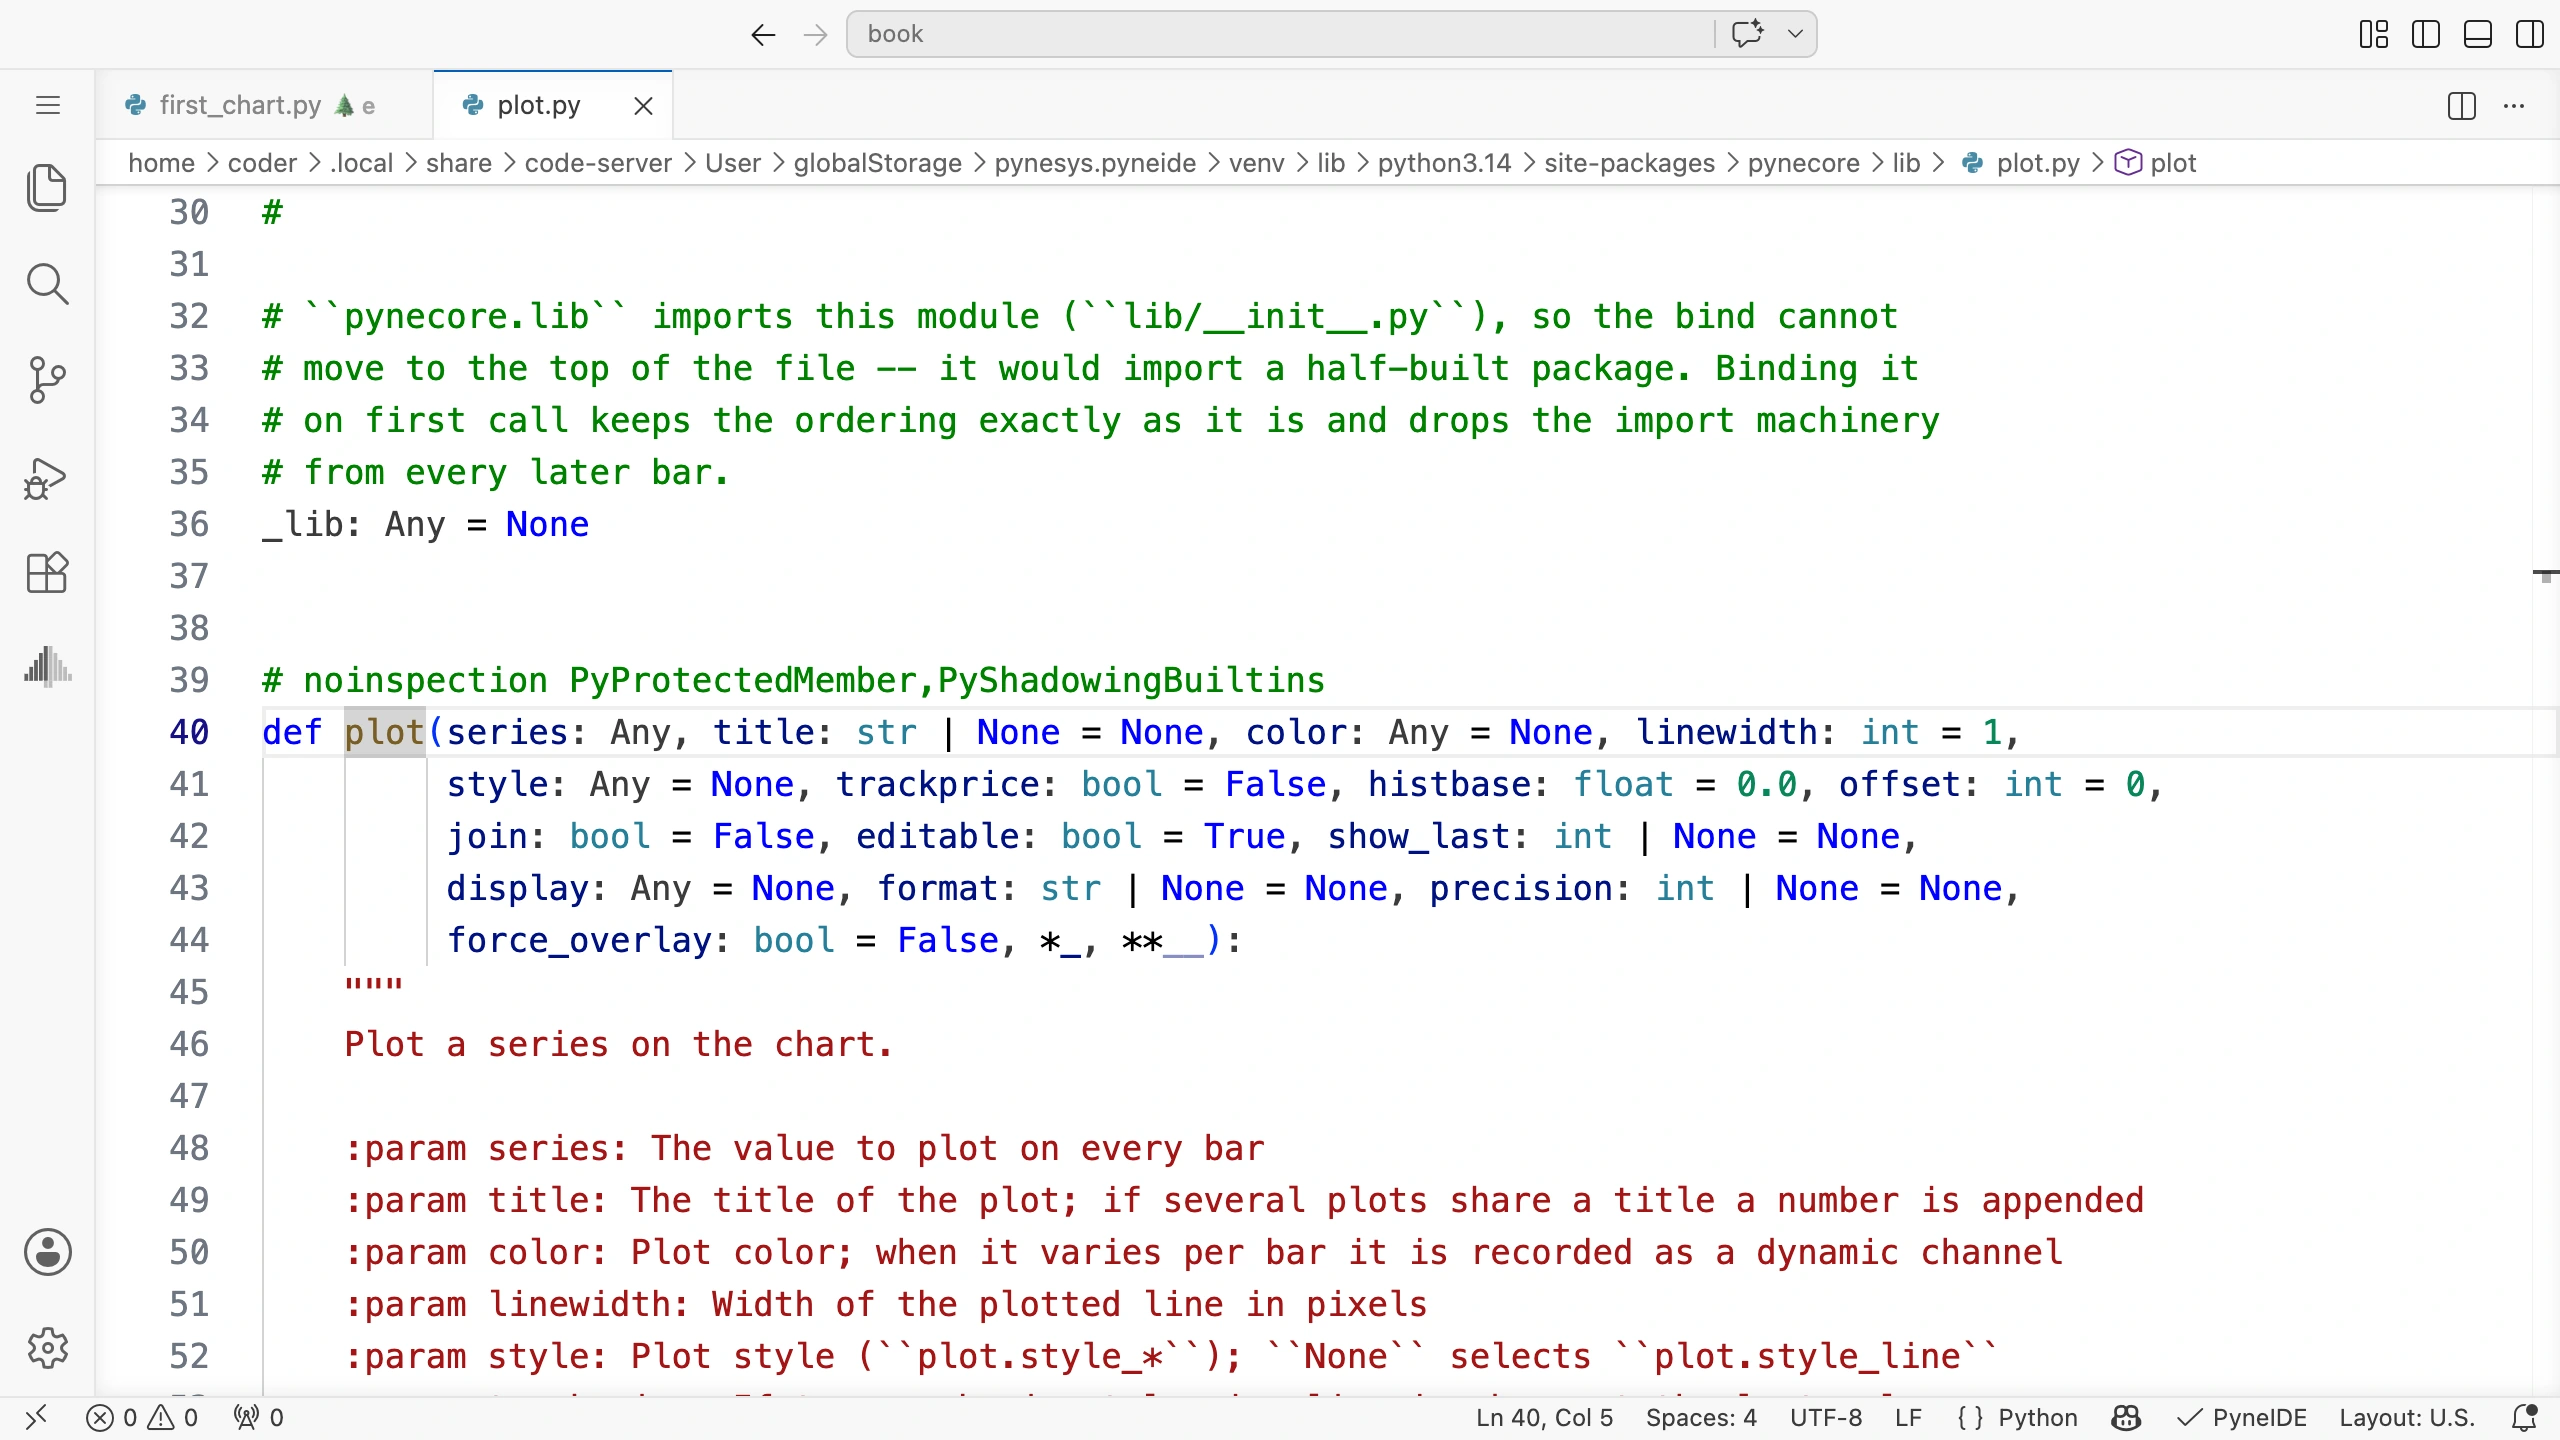
You do not need to know the library’s internals to complete the book’s examples. This option is useful if you want to investigate a function more closely later.
Try it yourself
Open the help for plot and find the linewidth parameter. What is its default value? Then look at your own call: does it use the same value?
Solution
The default value is 1. The first_chart.py program uses linewidth=2, so we set the line width to 2. If you leave this argument out of the call, the function uses the default of 1.