Read and change the code
Understand the lines of your first program and plot the opening price alongside the closing price.
We will now plot the opening price alongside the closing price. To do this, we extend the previous chapter’s program: we request another value from the library and add another plotting call to the code.
Before making the change, we go through the program’s lines so you understand what each one does.
Code is a precise description
In a program, you give instructions to the computer. For example: “Use the candle’s closing price and display it as a blue line.” The computer expects precise names and punctuation for this.
In Pyne code, we write these instructions using Python syntax. The parentheses in function calls, colons, and indentation are all part of it. The following sections explain their roles.
Open the first_chart.py file you created in the second chapter. If you renamed the indicator inside it, that does not affect the explanation below.
The Pyne marker at the start of the file
The first three lines of the file:
"""
@pyne edge
"""
The triple quotes mark the beginning and end of a text block. At the start of a file, this block can also hold the program’s description. Python calls this a docstring.
PyneCore reads the @pyne marker from it. This tells it that the file contains Pyne code and that it must apply rules different from ordinary Python behavior. Before running the program, PyneCore transforms the code so that, for example, we can access previous candles’ values and a variable can keep its value for the next candle. Separate chapters cover these features.
The @pyne marker is valid on its own too. A Pyne code file can also begin like this:
"""
@pyne
"""
What does edge mean beside it?
The edge label means the program uses a defined, restricted subset of Pyne code. @pyne enables candle-by-candle behavior; edge defines which language features and functions we can use with it. PyneIDE warns us if we go beyond those limits.
Programs marked @pyne can also use Python’s other features and libraries. Programs marked @pyne edge use the tools allowed by Pyne and do not import arbitrary Python libraries. This lets runtimes process them even when they do not provide a general Python environment.
We keep the @pyne edge marker in every complete program in this book and work within that language subset.
More detail: where should the marker go? The opening text block must be the file’s first statement, and @pyne must be its first content. You can write the program’s description after the marker. If the description comes before @pyne, PyneCore does not recognize the marker. The marker alone does not start the program: PyneCore also needs to load and run it. PyneIDE handles this in the book’s examples.
For example, you can add a program description to the start of the file like this:
"""
@pyne edge

Open and Close
Shows each candle's opening and closing prices as two lines.
"""
The @pyne edge marker remains the first content line in the text block. The title and description below it are for the reader; they do not add an operation to the program. The imports and the rest of the program follow the closing triple quotes as usual.
Choose the tools
The next line:
from pynecore.lib import close, color, plot, scriptThe from … import … structure makes the listed names available to the program. In this example, we request four tools from the pynecore.lib library:
close: the current candle’s closing price;color: the available colors;plot: display a value on the chart;script: specify the program’s type and basic settings.
Commas separate the names. Uppercase and lowercase letters matter: close and Close are different names.
Blank lines help organize the code. They make it easier to see where the list of tools ends and the program begins.
The program’s name and appearance
@script.indicator("My First Chart", overlay=True)This line says we are creating an indicator. An indicator calculates and displays something from the data. In this example, we plot the closing price.
We specify the indicator’s settings inside the parentheses:
- The text
"My First Chart"in quotation marks is the indicator’s name. overlay=Truerequests that the plot appear on the same chart as the candles.
True means a true value. Its opposite is False. If you set overlay to False, the indicator appears in a separate panel. We use this in the chapter on your own calculations too.
Where the calculation happens
def main():
    plot(close, "Close", color=color.blue, linewidth=2)
def marks the start of a function. A function is a named sequence of operations. Here, its name is main.
PyneCore executes the body of main() on the data’s candles. This is our program’s entry point. A colon follows the pair of parentheses, and the indented line below it belongs to the function’s body.
Indentation tells us which lines belong together. We use four spaces for one level of indentation. Press Tab at the start of a line: with PyneIDE’s default settings, this adds four spaces of indentation in one step. Shift + Tab moves the line back one level. Visual Studio Code usually indents a new line automatically when you press Enter after a line ending in a colon.
What are we asking plot to do?
plot(...) is a function call. Inside the parentheses, we pass the values and settings it needs:
close: display this value;"Close": use this name for the plot;color=color.blue: make it blue;linewidth=2: set the line width to 2.
For the first two values, their order determines their role. color= and linewidth= name the settings we are passing. These are called parameters.
The dot in color.blue means we use the blue color belonging to color. The dot is part of accessing a name in the code; do not replace it with a comma.
Draw two lines
We used close for the closing price. You can access the opening price through the name open.
Make a copy of the file named two_lines.py in the scripts folder. This keeps the second chapter’s example too. In the copy:
- Add
opento the imported tools. - Rename the indicator to
"Open and Close". - Add a second
plotcall to the body ofmain().
The complete program:
"""
@pyne edge
"""
from pynecore.lib import close, color, open, plot, script


@script.indicator("Open and Close", overlay=True)
def main():
    plot(close, "Close", color=color.blue, linewidth=2)
    plot(open, "Open", color=color.orange, linewidth=2)
Before running it, try to predict where the two lines will meet the candles. Save the file and click Run Pyne code. Use the same sample data as before.
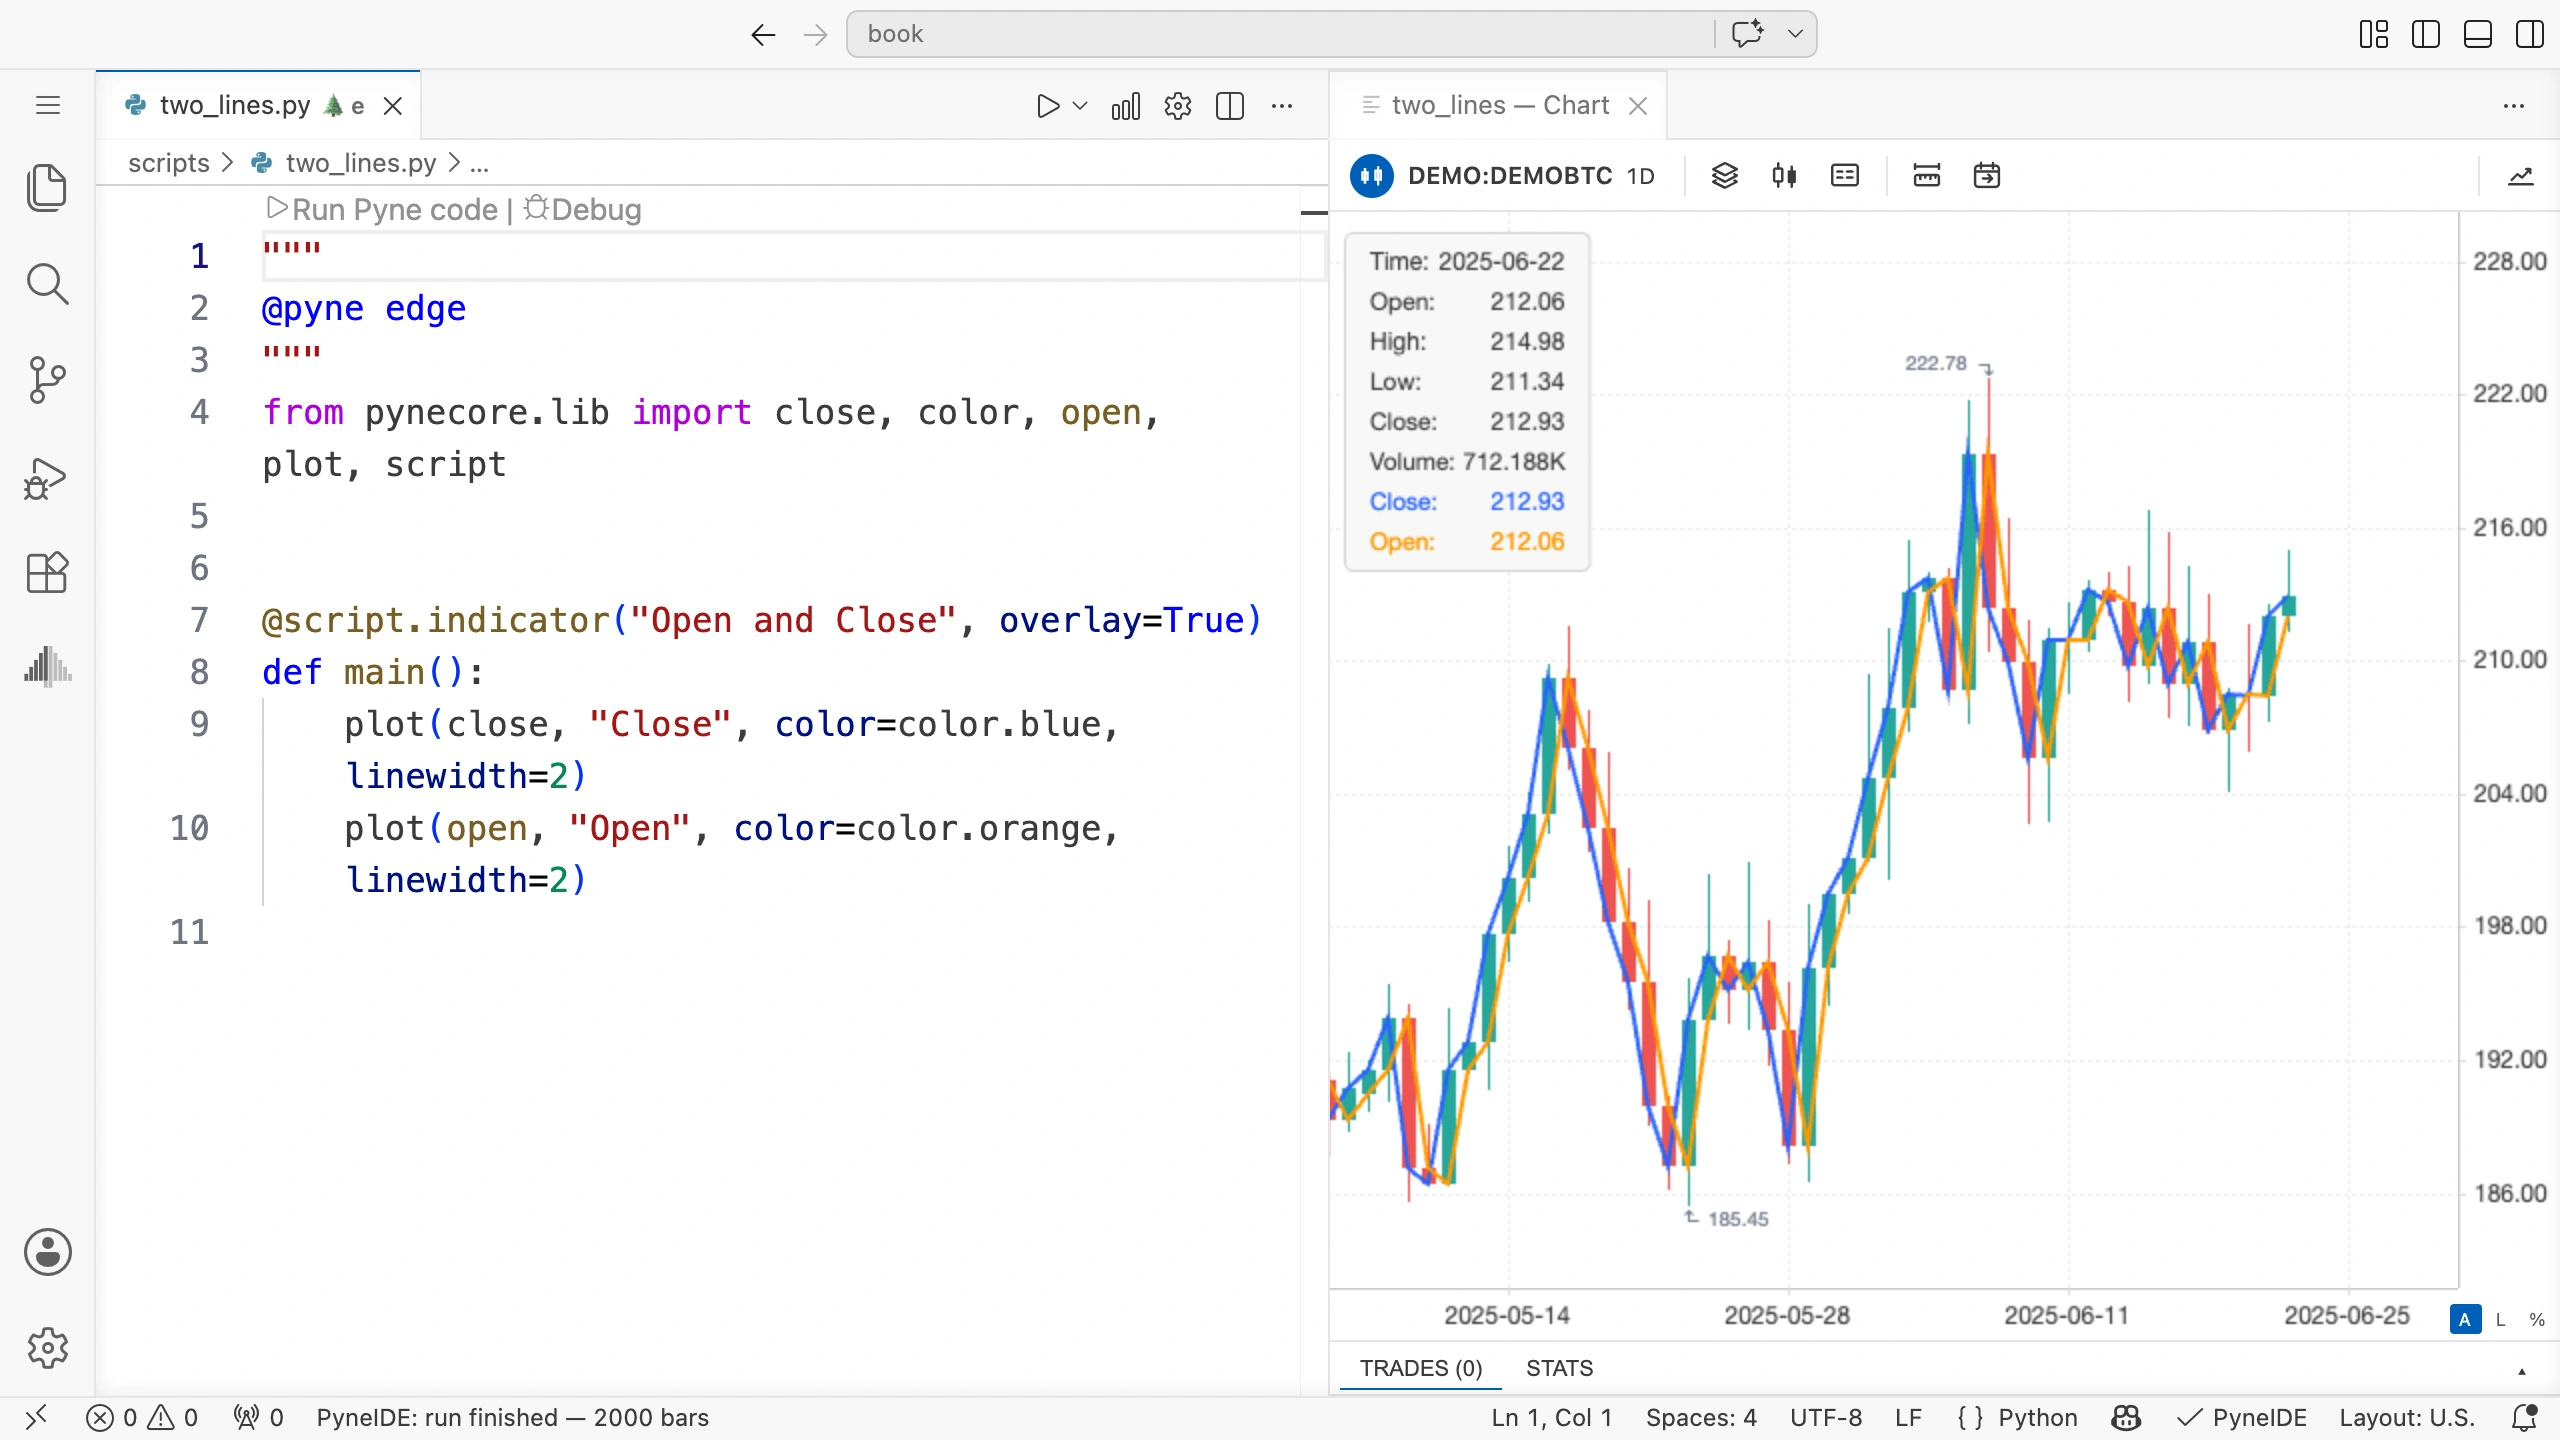
What should you observe?
The blue line connects the candles’ closing prices, and the orange line connects their opening prices. The plots also have names: Close and Open. Names help you identify them even if you change the colors later.
Both plot calls begin with the same four-space indentation because they belong to the same main() function.
If an error appears under open, check that you added it to the import line. Before using another tool, you must make its name available too.
Comments in code
A line beginning with a single # is a comment:
    # Show the opening price of each candle.
    plot(open, "Open", color=color.orange, linewidth=2)
A comment does not perform an operation. You can use it to describe a step’s purpose for yourself or someone reading the code later. The example comments and the explanations in this book are in English.
You can also write a comment at the end of a statement:
plot(open, "Open", color=color.orange, linewidth=2) # Show the opening price.The plot(...) call still runs. The text from the following # to the end of the line is a comment, so the runtime ignores it. We leave two spaces between the code and # to make it easier to read.
Try it yourself
Create a third line that shows each candle’s highest price. Its name is high. Name the plot "High" and use color.green for its color.
Think about which two places you need to extend in the program. Before running it, predict: can the High value fall below its own candle’s opening or closing price?
Solution
You also need to add high to the import line:
from pynecore.lib import close, color, high, open, plot, scriptAdd this line to the body of main(), using the same indentation as the other two calls:
plot(high, "High", color=color.green, linewidth=2)A candle’s highest price is at least as high as its opening and closing prices. Therefore, the High point cannot fall below either of them at that candle. Always interpret the line segments connecting points at the position of the relevant candle.
Check your changes
Read through the three-line program. Can you find the imported data, the indicator’s name, and the plotting calls? Check that every newly used data name appears in the import line and that all three calls have the same indentation.
Before we calculate our own values from prices, we look at how PyneIDE helps you use functions.