Moving averages
Create SMA and EMA lines and observe how the calculation window changes.
The closing-price line follows every candle’s price movement. Averaging several successive closing prices gives a smoother line. In this chapter, you create two moving averages using ten candles.
Calculate the average
The simple average of three values is their sum divided by three. If the values are 100, 103, and 101, the average is:
(100 + 103 + 101) / 3 = 101.333...A moving average’s window has a fixed size, but moves forward with the candles. On the next candle, a three-candle window gains the new closing price and loses the oldest one.
If the new close is 105, the next average is (103 + 101 + 105) / 3, or 103. The first closing price of 100 is no longer in this window.
A ten-candle simple moving average needs the current close and the previous nine closes. We do not use the current candle plus ten earlier candles: ten is the total number of values included.
Functions in ta
The ta namespace contains ready-made calculations. ta.sma(close, 10) returns the simple moving average of ten closing prices. SMA stands for “simple moving average.”
The call’s two arguments are:
close: the source to average;10: the window size in candles.
During the first nine candles, ten closing prices are not yet available. The SMA is na there, and its first valid value appears on the tenth candle. This initial period is also called warmup.
The window size is not a duration in seconds. Ten daily candles and ten hourly candles cover different periods of time.
SMA and EMA side by side
An EMA, or exponential moving average, gives more weight to recent values. ta.ema(close, 10) also uses a length parameter of ten candles, but calculates it with a different formula.
The EMA starts from the simple average of the first complete window. With a length of ten, both lines therefore appear on the tenth candle. Afterward, the EMA adds a fraction of the difference between the new price and the previous EMA to its previous value. That fraction is 2 / (10 + 1).
Create moving_averages.py:
"""
@pyne edge
"""
from pynecore.lib import close, color, plot, script, ta


@script.indicator("Two Moving Averages", overlay=True)
def main():
    simple_average = ta.sma(close, 10)
    exponential_average = ta.ema(close, 10)
    plot(simple_average, "SMA 10", color=color.blue, linewidth=2)
    plot(exponential_average, "EMA 10", color=color.orange, linewidth=2)
Run it on the demo data. The blue SMA and orange EMA appear alongside the price candles. Move through the price chart and observe sections where the price suddenly changes direction. The two averages do not necessarily react at the same rate.
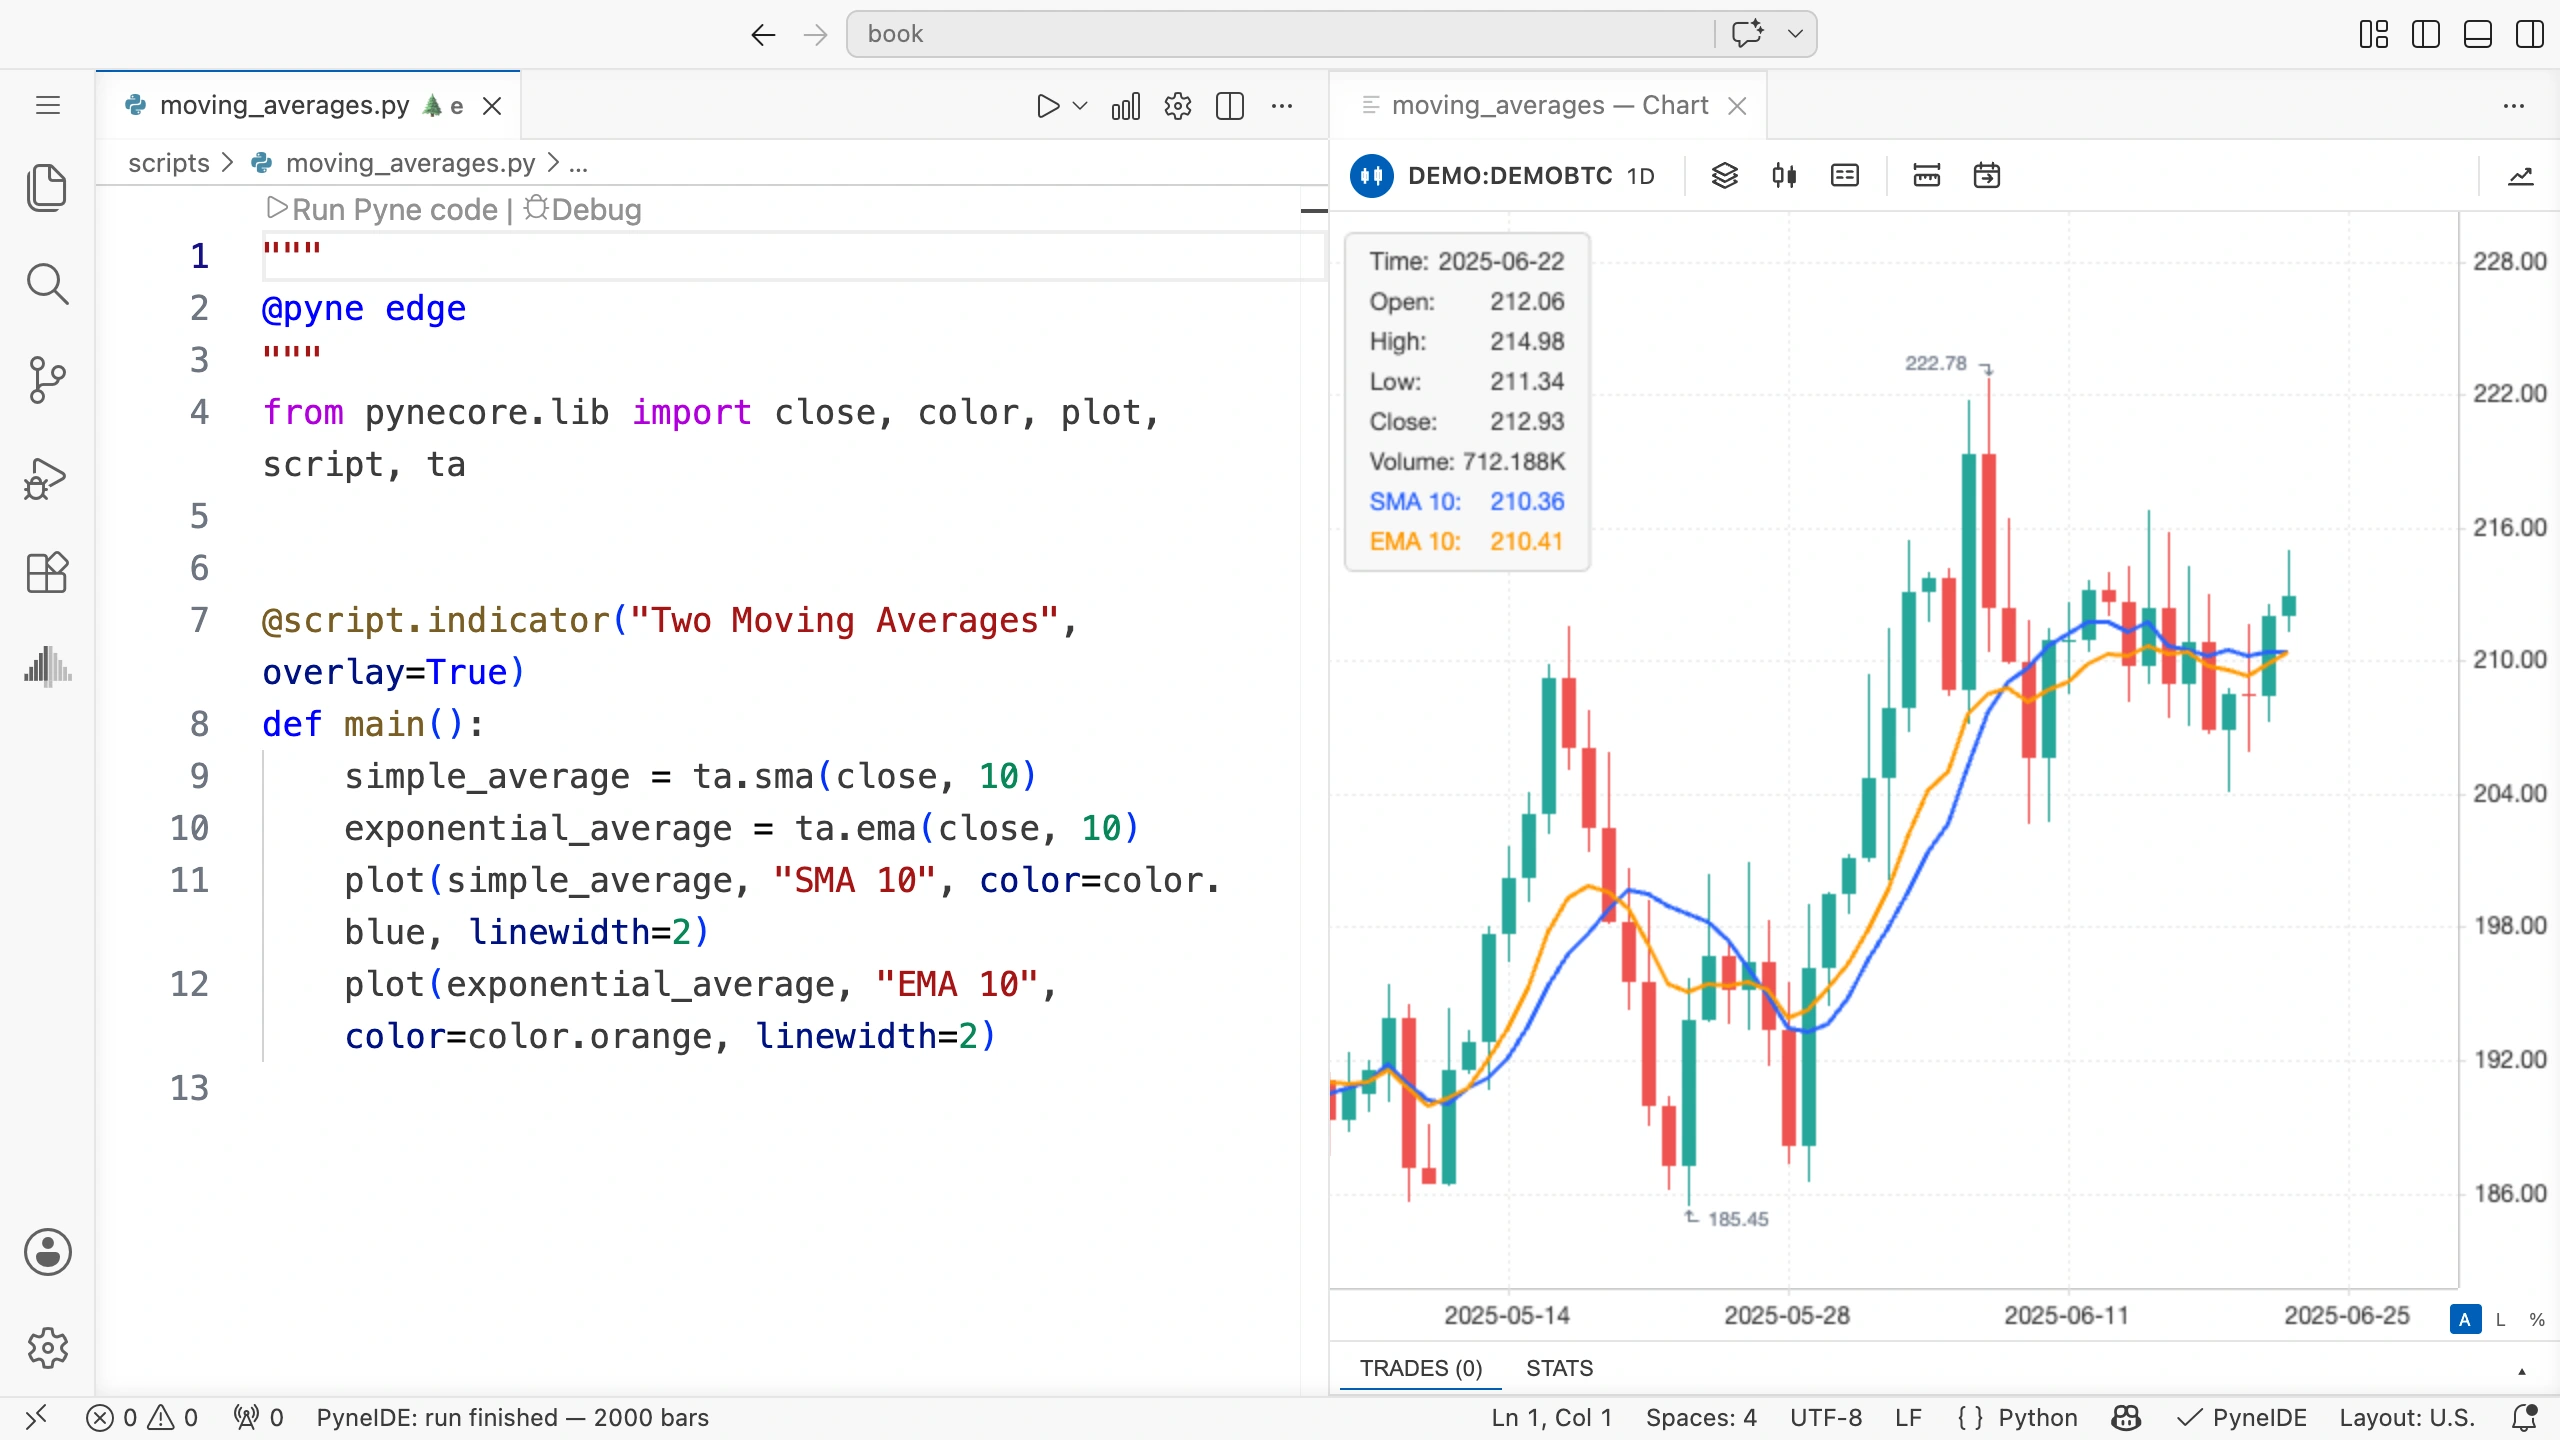
An average is a line calculated from past values. Its smoother shape alone does not tell you where the price will move next.
Why calculate on every candle?
ta.sma and ta.ema also use calculation state between successive executions. In this example, both calls run on every candle.
Later, we write code that performs an operation only in certain cases: for example, drawing a marker when the closing price is above the average. You learn this in Conditions and markers.
Even then, calculate the average on every candle and decide afterward how to use it. For example, if you call ta.sma only on rising candles, its calculation skips the other candles, so the result can differ from an average calculated across the full candle sequence. For now, make sure both average calculations run on every candle.
These two lines do not need a Series annotation on your own variables: we plot the current values and do not use an expression such as simple_average[1]. If you later index your own variable’s history directly, add the Series[float] annotation.
Longer and shorter windows
Increasing the length lets more earlier prices affect the average. The line is usually smoother and follows price changes later. With a shorter length, recent price movements have a stronger effect.
Try this on the same data:
- Run the two length-ten averages and observe a recognizable price reversal.
- Change the length to 30 in both calls.
- Also change the line titles to
SMA 30andEMA 30. - Run again and find the same point in time.
We change the title too because "SMA 10" is only a label. The number in it does not change the calculation. The call’s second argument controls the window.
Try it yourself
Create two simple moving averages: one using five candles and the other using twenty. Make the short one blue and the long one orange. Give each a suitable title.
Solution
In the body of main(), replace the two calculations and plotting calls with:
fast_average = ta.sma(close, 5)
slow_average = ta.sma(close, 20)
plot(fast_average, "SMA 5", color=color.blue, linewidth=2)
plot(slow_average, "SMA 20", color=color.orange, linewidth=2)
For length five, the first four candles have missing values; for twenty, the first nineteen do. After warmup, both lines use the same closing-price series with different window sizes.
Check the window
You can check a three-candle SMA by hand. Set the length to three, choose three successive closing prices, and calculate their average. The chart shows the same value on the third candle. The first two candles do not have a complete window.