Variables and your own calculations
Calculate a range and a midpoint from candle data, then display the results.
If a candle’s highest price is 108 and its lowest is 101, the difference is 7. We will calculate and plot this price range for every candle.
The second program calculates the midpoint between the two prices. Both examples use variables and simple arithmetic.
What does a candle represent?
A candle summarizes data for a period. The timeframe determines that period’s length. For example, in hourly data, one candle represents one hour.
You encounter five basic values:
open: the period’s opening price;high: the period’s highest price;low: the period’s lowest price;close: the period’s closing price;volume: the period’s trading volume, in the units used by the data source.
Their initials form the abbreviation OHLCV. The book’s first examples use sample data for candles that have already closed.
close always means the closing price of the candle the program is currently processing. On the next candle, it uses that candle’s closing price instead. The same applies to the other basic values.
A little history: where do Japanese candlesticks come from?
Candlestick charting has its roots in Japan’s 18th-century rice markets. The price analysis methods developed there evolved into candlestick charts in the 19th century. Steve Nison introduced them to a wider Western audience with his 1991 book Japanese Candlestick Charting Techniques.
A candle’s thicker “body” shows the area between its opening and closing prices; the thin “wicks” mark the period’s highest and lowest prices.
Calculate the range
If the highest price is 108 and the lowest is 101, the price covered a range of 7 units:
108 − 101 = 7
We write this in code as:
candle_range = high - lowhigh - low is an expression: the program evaluates it and produces a result. - means subtraction.
candle_range is a variable’s name. = assigns the result of the expression on the right to it. We call this operation assignment.
Read the line as: “Calculate the difference between high and low, and name the result candle_range.” You can then use that value by this name in the rest of the program.
Choose a clear name
candle_range tells you the value is a candle’s range. A name such as x does less to help you read the code.
In this book, we use lowercase English variable names with underscores between words. A name must not begin with a number or contain spaces. candle_range and Candle_range would be different names.
Why use English names without accents?
The language’s keywords and Pyne’s library names are based on English words, such as def, close, and plot. English variable names fit alongside these and make source code easier for an international audience to understand. This is useful when you share your program with others or work on it together.
Pyne code also allows accented letters and letters from other alphabets in variable names. Using English names without accents is therefore a naming recommendation. They are easier to type on keyboards for other languages, and they make code simpler to share internationally. We use this form consistently throughout the book.
Create an indicator in a separate panel
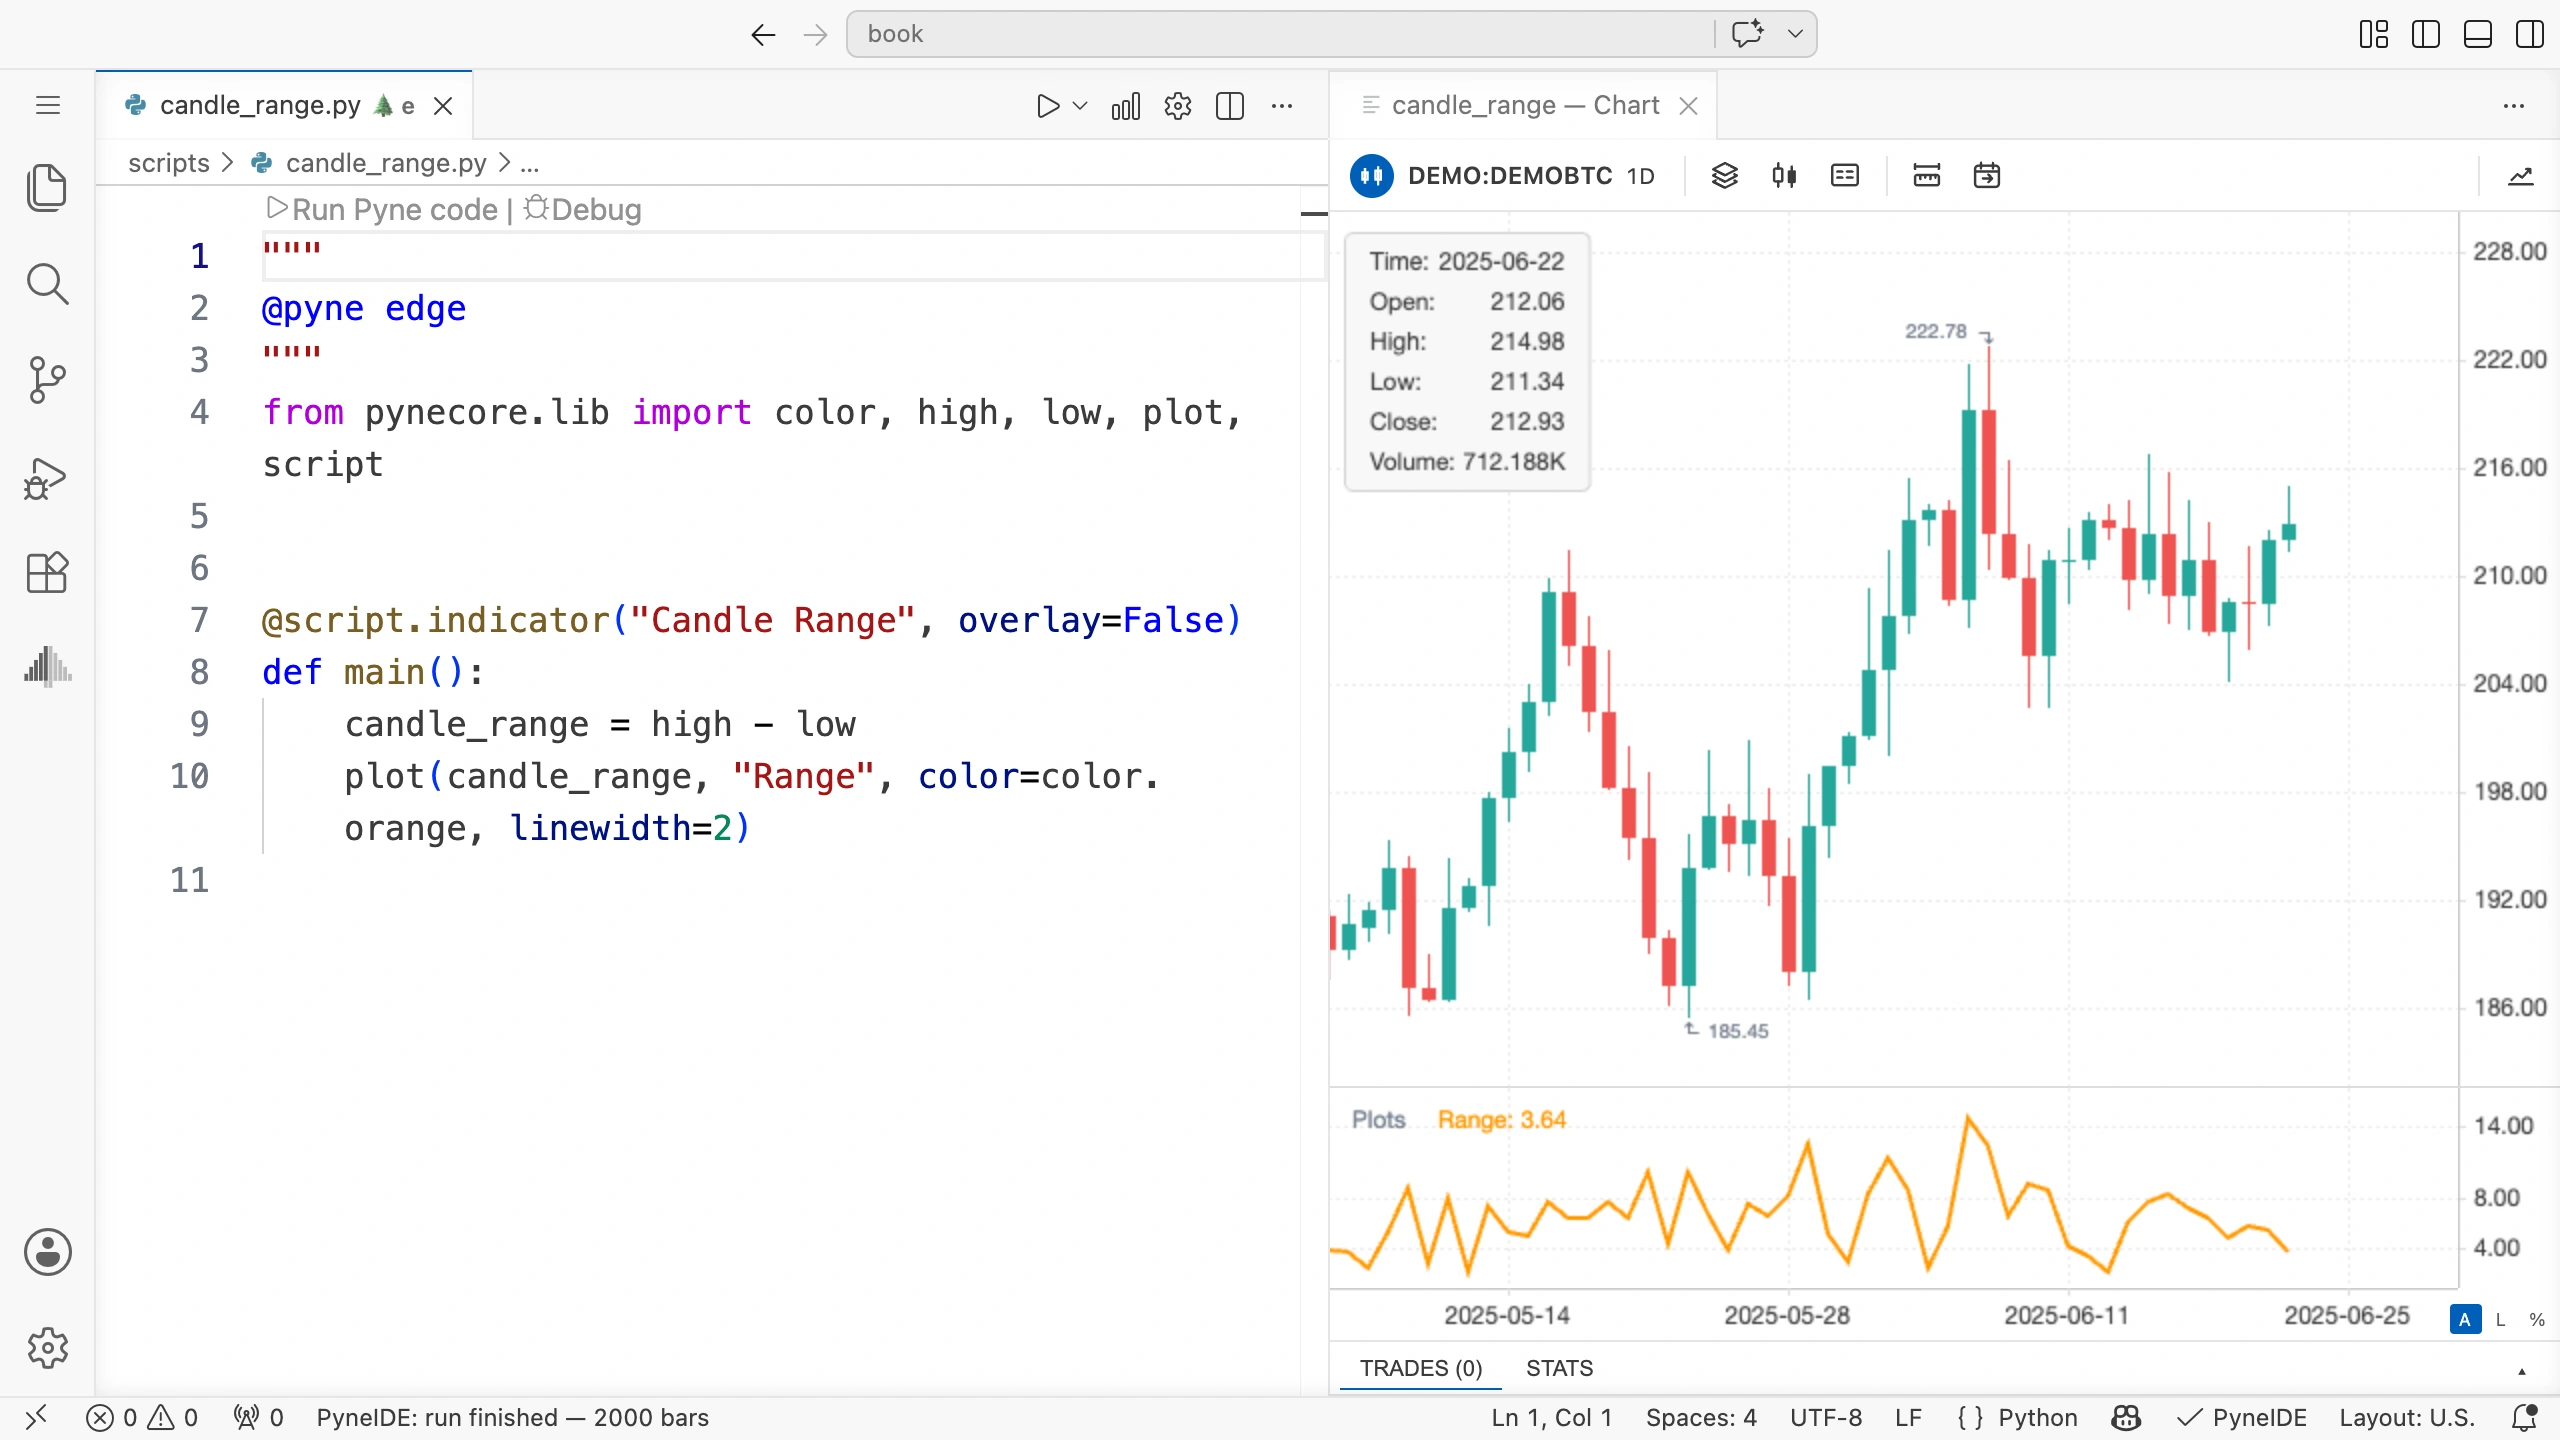
Create a file called candle_range.py in the scripts folder and write this program in it:
"""
@pyne edge
"""
from pynecore.lib import color, high, low, plot, script


@script.indicator("Candle Range", overlay=False)
def main():
    candle_range = high - low
    plot(candle_range, "Range", color=color.orange, linewidth=2)
The first line of main() calculates the value; the second passes it to plot under the name candle_range. You must assign a value before using it.
overlay=False requests a separate panel. This lets you see the range on its own scale: a range of 7 units and a price around 100, for example, have different magnitudes.
Save and run the program on the same demo data.
How do you read the result?
Higher points correspond to larger price differences. Lower points mark smaller ranges. The calculation uses the candle’s full high and low, including its wicks.
Rising and falling candles can have the same range, so this value does not tell you the direction of the price move. high is at least as large as low, so with valid candle data, the result is never negative.
What does the variable do on the next candle?
The program repeats these two steps on each candle it processes:
- It calculates
candle_rangefrom that candle’shighandlowvalues. plotdisplays this value at that candle’s position.
For example:
- First candle:
high= 108,low= 101, socandle_range= 7. - Second candle:
high= 110,low= 106, socandle_range= 4. - Third candle:
high= 109,low= 103, socandle_range= 6.
This creates three chart points at 7, 4, and 6. On every candle, the variable receives the result of the current calculation.
We cover access to previous candles’ values and retained state later.
Addition, multiplication, and division
We use the following symbols for simple calculations in code:
+: addition;-: subtraction;*: multiplication;/: division.
Multiplication and division happen before addition and subtraction. Parentheses let you specify what to calculate first.
The midpoint of the price range:
midpoint = (high + low) / 2First we add the two prices, then divide the result by two. If high = 108 and low = 101, the midpoint is 104.5.
Notice the decimal point: the code uses 104.5. Commas have other roles in code, such as separating function parameters, so do not use a comma as a decimal separator.
Plot the midpoint
Create a file called candle_midpoint.py:
"""
@pyne edge
"""
from pynecore.lib import color, high, low, plot, script


@script.indicator("Candle Midpoint", overlay=True)
def main():
    midpoint = (high + low) / 2
    plot(midpoint, "Midpoint", color=color.purple, linewidth=2)
Here we use overlay=True again. We want the midpoint to share the candles’ price scale.
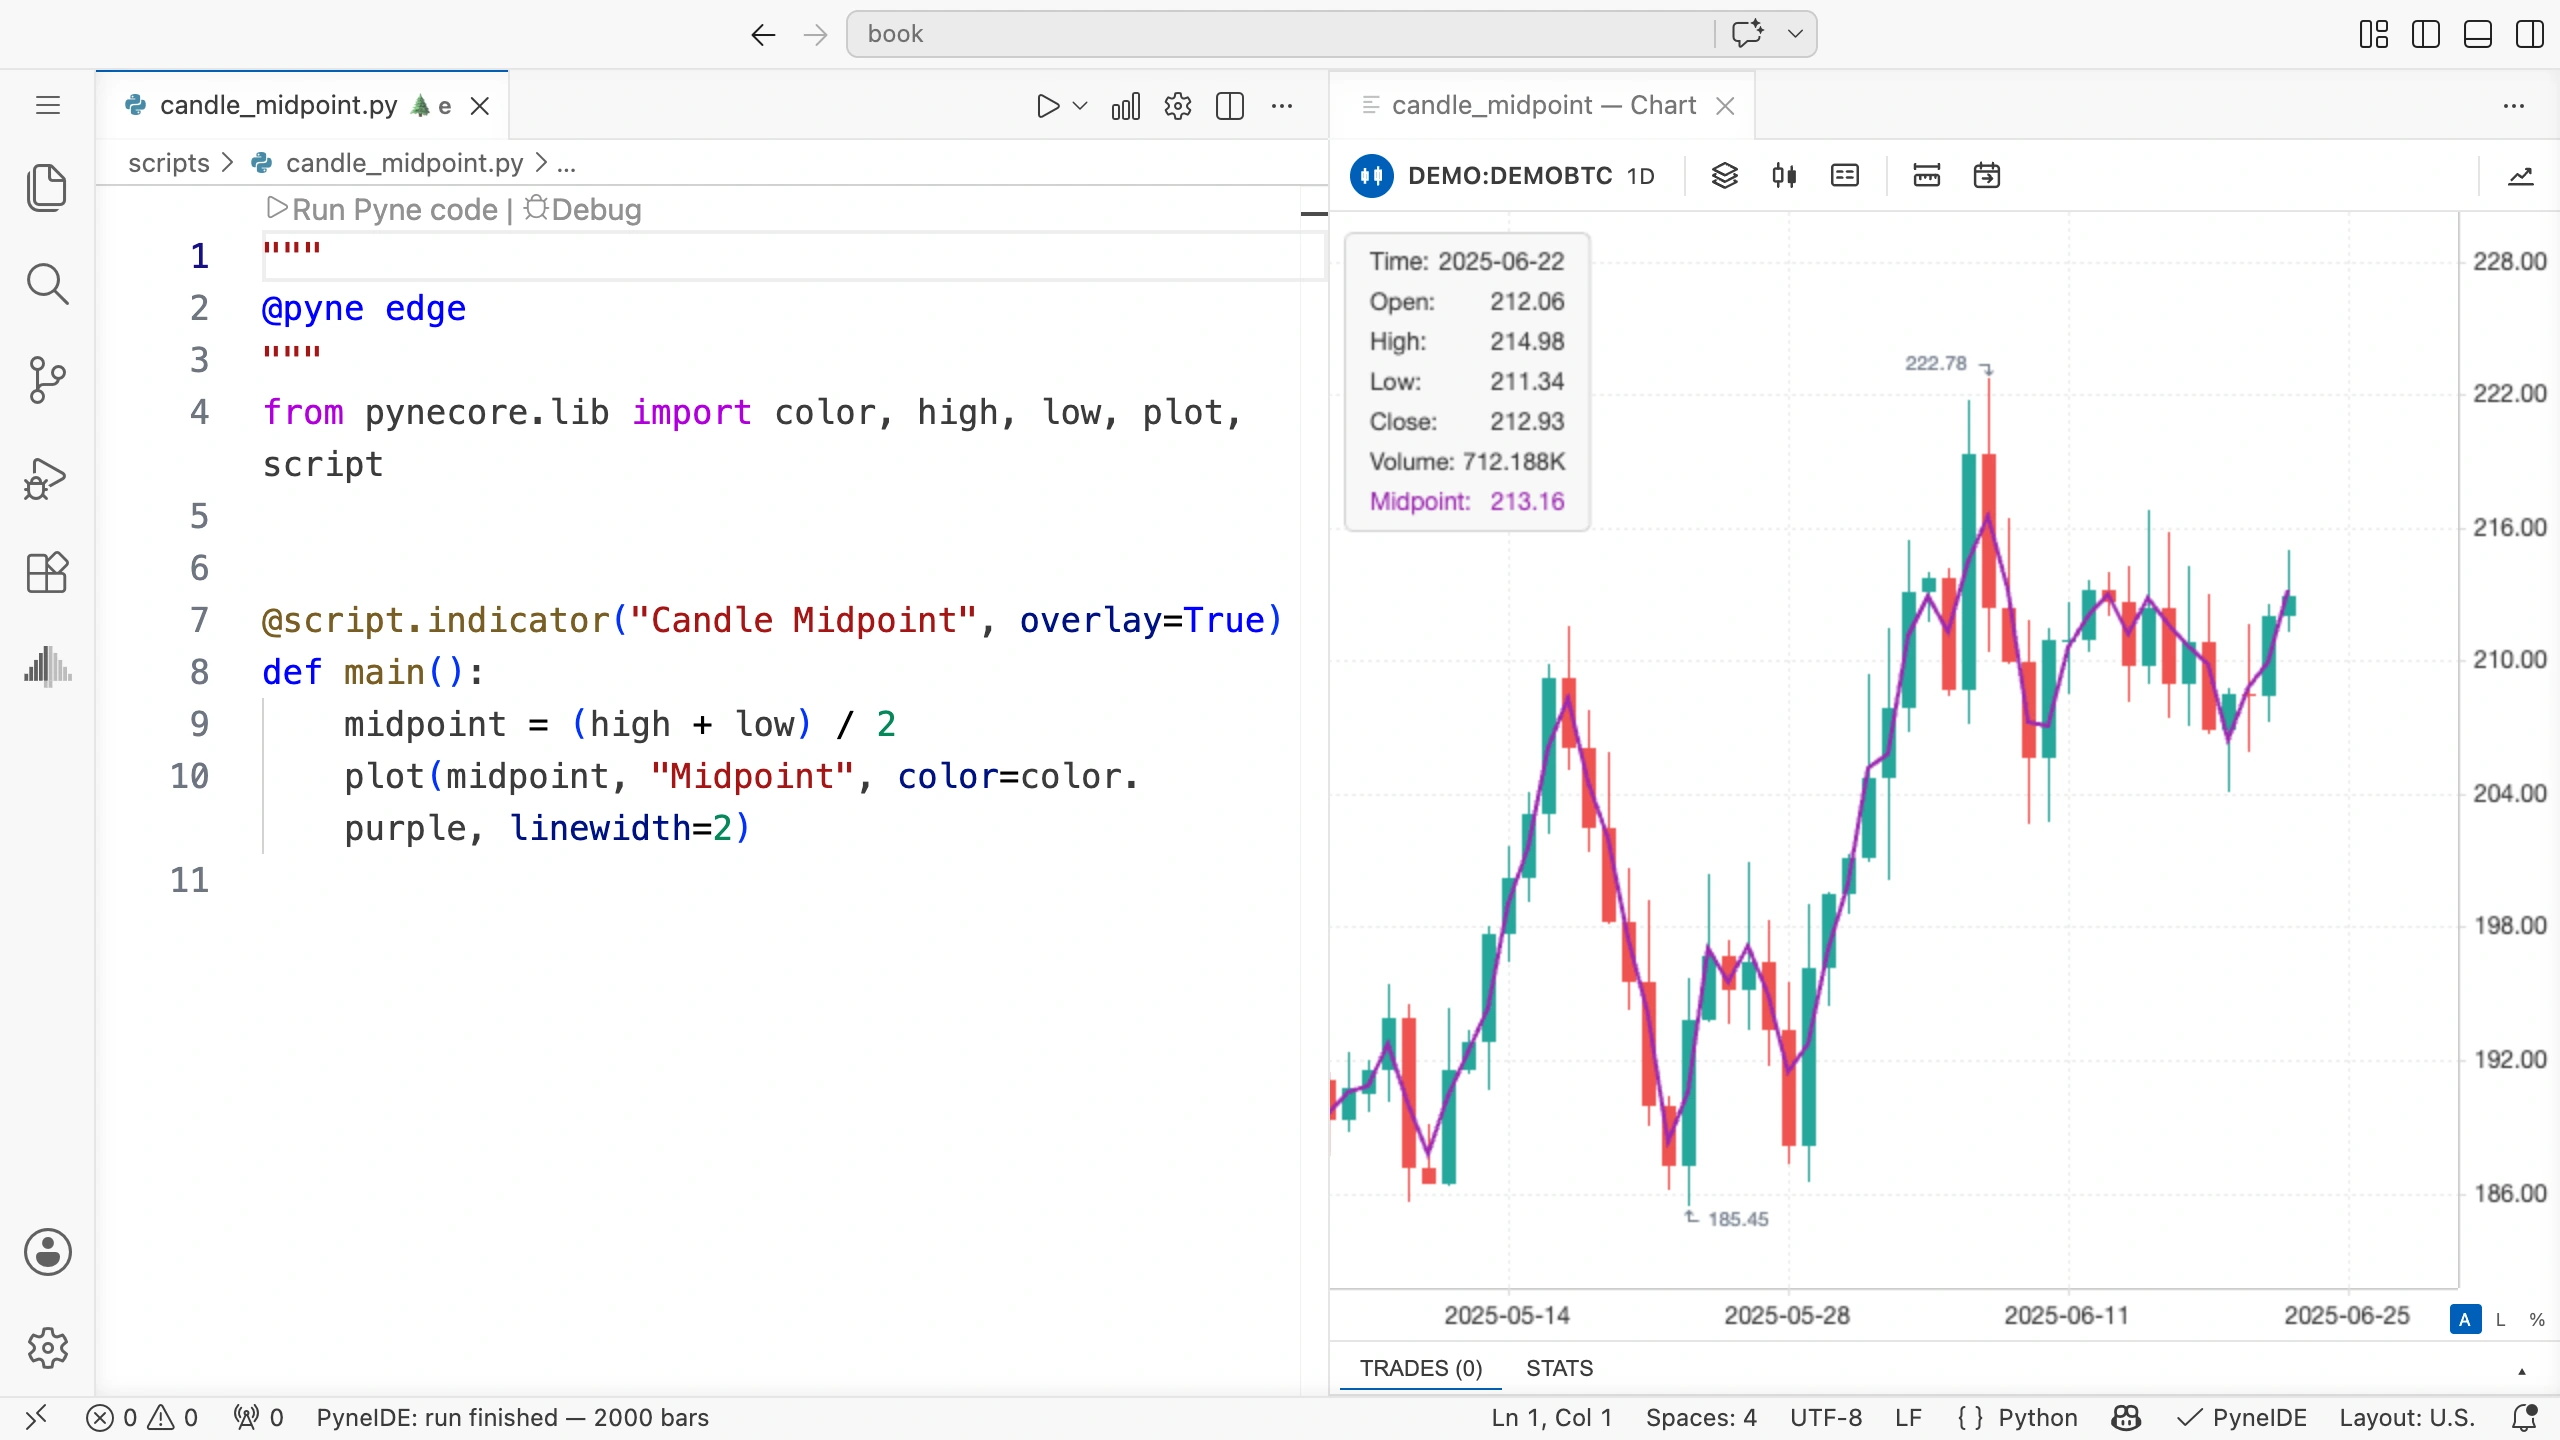
After running it, select a candle and look at the line’s point at that candle’s position. The point is halfway through the candle’s full range, including the wicks. It can differ from the center of the candle’s body, which is determined by its opening and closing prices.
Why do parentheses matter?
The following two expressions describe different calculations:
(high + low) / 2
high + low / 2
The second line first divides only low by two, then adds high. With the values 108 and 101 above, you would get 158.5. That is no longer the midpoint between the two prices.
Both expressions have valid syntax, yet produce different results. An example you can calculate by hand is a quick way to check whether you wrote what you intended.
Try it yourself
Plot the signed change across the candle’s body: subtract the opening price from the closing price.
- Name the file
candle_change.py. - Use
"Candle Change"as the indicator’s title and put it in a separate panel. - Name the calculation’s result
candle_change. - Name the plot
"Change".
Before running it, calculate the expected result in three cases:
open= 100,close= 104;open= 100,close= 97;open= 100,close= 100.
Solution
The three results are 4, −3, and 0. A positive value means a higher close, a negative value means a lower close, and zero means the opening and closing prices are equal.
"""
@pyne edge
"""
from pynecore.lib import close, color, open, plot, script


@script.indicator("Candle Change", overlay=False)
def main():
    candle_change = close - open
    plot(candle_change, "Change", color=color.blue, linewidth=2)
Compare the three programs
Open the programs for the range, midpoint, and change one after another. Each calculates a variable from OHLC data and plots it on the next line. The program processes the data candle by candle. The differences are the calculation and the overlay setting.
In the next chapter, we compare values from two candles and look at how to access the previous candle’s data.