Time and previous candles
Understand candle-by-candle execution and calculate changes using previous values.
In the previous chapter, you calculated values from a single candle’s data. A change in closing price needs two candles: the current one and the previous one. In this chapter, you connect them.
The program stays the same; the candle changes
When you run a program on the demo data, PyneCore processes the candles in time order. main() works with the first candle, then the second, and so on. Each time, close means the closing price of the candle currently being processed.
This is how a single plot(close, "Close") call can draw an entire line. One execution adds one point to the line; the sequence of candles produces the complete line.
The previous chapter’s midpoint = (high + low) / 2 line also runs again on each candle. The assignment recalculates that candle’s midpoint. The variable’s name stays the same; its value may change.
The runtime ensures the processing order. You do not need to write your own loop to traverse the entire chart.
Look back with square brackets
close[1] is the closing price one candle ago. The number in square brackets tells us how far to look back.
| Expression | Which closing price does it mean? |
|---|---|
close | The candle being processed |
close[0] | Also the candle being processed |
close[1] | The candle one step earlier |
close[2] | The candle two steps earlier |
If three successive daily closing prices are 100, 103, and 101, then on the third candle, close is 101, close[1] is 103, and close[2] is 100.
Here, close - close[1] is 101 - 103, or −2. This is the difference between two successive closing prices. close - open compares the opening and closing prices of the same candle. The two calculations answer different questions.
Lookbacks are measured in candles, not calendar days. In daily market data, a weekend or market holiday can mean the previous candle is several days earlier.
Your own values can have history too
The built-in prices already have history available. To look back at your own calculation, mark it as a Series variable:
midpoint: Series[float] = (high + low) / 2The part after the colon is a type annotation. float means a number that can have a fractional part. Series[float] also asks the runtime to retain the variable’s history for each candle.
The assignment still runs on each candle. midpoint is the current calculated value; midpoint[1] is the value stored on the previous candle. You need to import Series from the pynecore module.
Two kinds of change on the chart
Create history_change.py in the project’s scripts folder:
"""
@pyne edge
"""
from pynecore import Series
from pynecore.lib import close, color, high, low, plot, script


@script.indicator("Changes Between Candles", overlay=False)
def main():
    midpoint: Series[float] = (high + low) / 2
    close_change = close - close[1]
    midpoint_change = midpoint - midpoint[1]
    plot(close_change, "Close change", color=color.blue)
    plot(midpoint_change, "Midpoint change", color=color.orange)
Save it, then choose Run Pyne code and the demo data. Two lines appear in a separate panel. Blue shows the change in closing price; orange shows the change in midpoint. A positive point means that value increased from the previous candle.
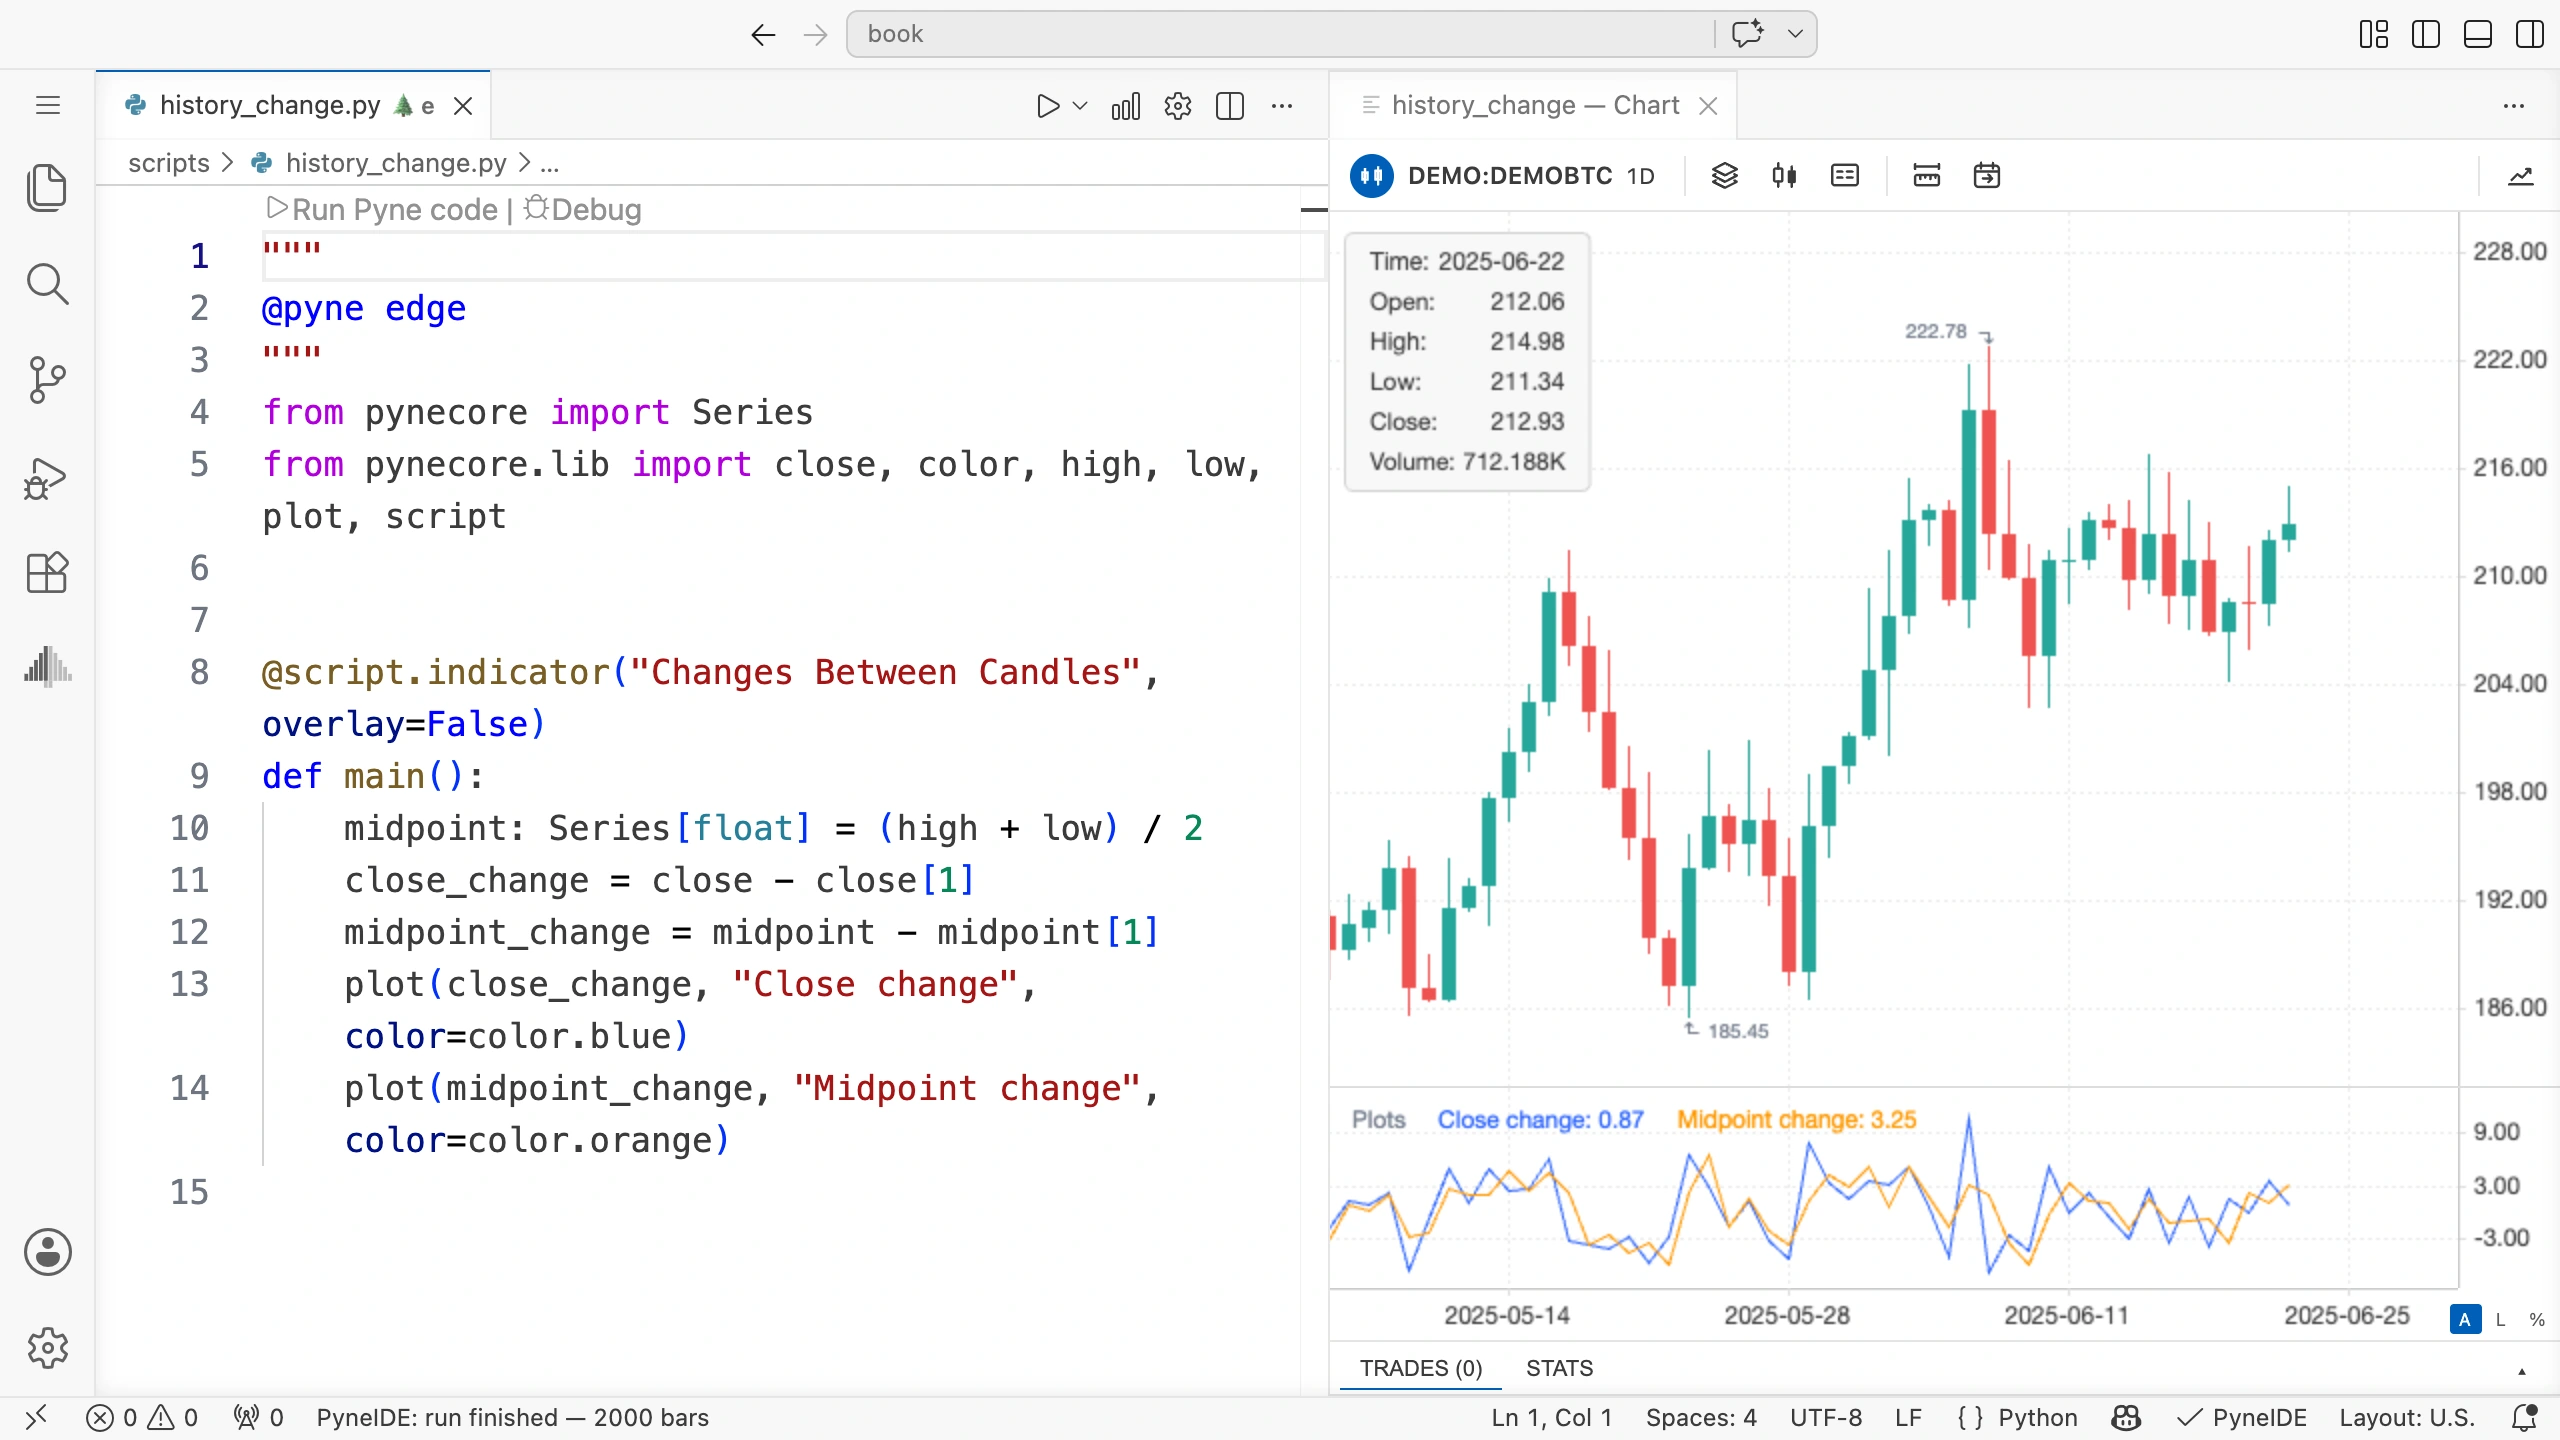
Hover over a candle. The chart values always show the time under the pointer; you do not need to select that time separately in the file.
What happens on the very first candle?
The first candle has no earlier candle in the data file. There, close[1] is a missing value: na. The abbreviation comes from “not available.”
A missing price is not zero. The result of close - close[1] is also missing, so the program does not draw a valid change on the first candle. This is correct: we cannot calculate the difference between two candles from just one candle.
You can use na(value) to check whether a value is missing. You learn how to handle conditions in Conditions and markers. Until then, do not try to fix the missing point at the start of the chart by treating it as a zero price.
This notation does not make future candles available. close[-1] does not mean the next closing price either. A decision can use only data available at that execution.
Try it yourself
Change the blue line to compare the closing price with the close five candles earlier. Indicate the five-candle distance in the line’s title too.
Before running it, decide: how many candles at the start will have a missing result?
Solution
close_change = close - close[5]
plot(close_change, "Five-candle change", color=color.blue)
The first five candles have no closing price five candles earlier. The sixth candle does: the closing price of the first candle in the data file.
The orange line does not change. To calculate both changes over five candles, you also need to change midpoint[1].
Check the calculation
Choose three successive candles. Write down their closing prices and calculate the one-candle change for the second and third candles by hand. The blue line should show those same values. If they differ, first check the selected times and the lookback number.
Extra exercise: retain a value instead of using history
You can also use a single previous value by storing it for the next candle. This is what a Persistent variable does, as you learn in What the program remembers. You can return to this exercise after reading that chapter.
Rewrite history_change.py so it contains neither close[1] nor midpoint[1]. Use two persistent variables to retain the previous candle’s closing price and midpoint. The two lines should show the same values as the original program, with the change still missing on the first candle.
Think through the order: when should you read the retained value, and when can you overwrite it with the current one?
Solution
Replace the Series import with Persistent:
from pynecore import PersistentAdd na to the pynecore.lib import. Keep the marker at the start of the file and the indicator settings, and rewrite main() as follows:
def main():
    previous_close: Persistent[float] = na
    previous_midpoint: Persistent[float] = na
    midpoint = (high + low) / 2
    close_change = close - previous_close
    midpoint_change = midpoint - previous_midpoint
    plot(close_change, "Close change", color=color.blue)
    plot(midpoint_change, "Midpoint change", color=color.orange)
    previous_close = close
    previous_midpoint = midpoint
Both retained variables start at na, because there is no previous price on the first candle. That makes the first difference missing too. At the end of the function, we store the current values; on the next candle, we use them in the calculation.
If you put previous_close = close before the subtraction, you subtract the current close from itself and get zero. With the persistent approach, you are responsible for the update order.
Both approaches work for looking back one candle. The square-bracket version is shorter and also gives direct access to values several candles earlier. These two persistent variables retain only the most recently stored prices.
Run both versions on the same demo data and compare the two lines on a few selected candles.