Conditions and markers
Use comparisons to choose a color and mark only candles that meet a condition.
Now you build a program that distinguishes rising candles from falling ones. It checks the relationship between the opening and closing prices, then shows the result with colors and markers.
True or false
The comparison close > open produces True if the close is greater than the open, and False otherwise. This is a Boolean value, with type bool.
The comparison does not change either price. It only answers a question.
| Symbol | Meaning | Example |
|---|---|---|
> | Greater than | close > open |
< | Less than | close < open |
>= | Greater than or equal to | close >= open |
<= | Less than or equal to | close <= open |
== | Equal to | close == open |
!= | Not equal to | close != open |
= assigns a value to a variable; == compares two values. The line bullish = close > open puts the comparison’s result in the bullish variable.
If the opening and closing prices are equal, neither close > open nor close < open is true. We handle this case too for a complete decision.
if, elif, and else
The condition after if determines whether the indented section runs:
if bullish:
    line_color = color.green
elif bearish:
    line_color = color.red
else:
    line_color = color.gray
First we check the if condition. If it is true, we choose green and skip the remaining branches. If it is false, elif comes next. else runs when none of the earlier conditions were true.
Each branch starts with a line ending in a colon. Another four spaces of indentation mark its contents. Inside main(), the if line therefore starts with four spaces and the assignment inside it with eight.
The complete program
Create candle_conditions.py:
"""
@pyne edge
"""
from pynecore.lib import close, color, location, open, plot, plotshape, script, shape


@script.indicator("Candle Conditions", overlay=True)
def main():
    bullish = close > open
    bearish = close < open
    if bullish:
        line_color = color.green
    elif bearish:
        line_color = color.red
    else:
        line_color = color.gray
    plot(close, "Close", color=line_color, linewidth=2)
    plotshape(bullish, "Bullish candle", style=shape.triangleup,
              location=location.belowbar, color=color.green)
Run it on the demo data. The closing-price line changes color for each candle. Green triangles appear below rising candles.
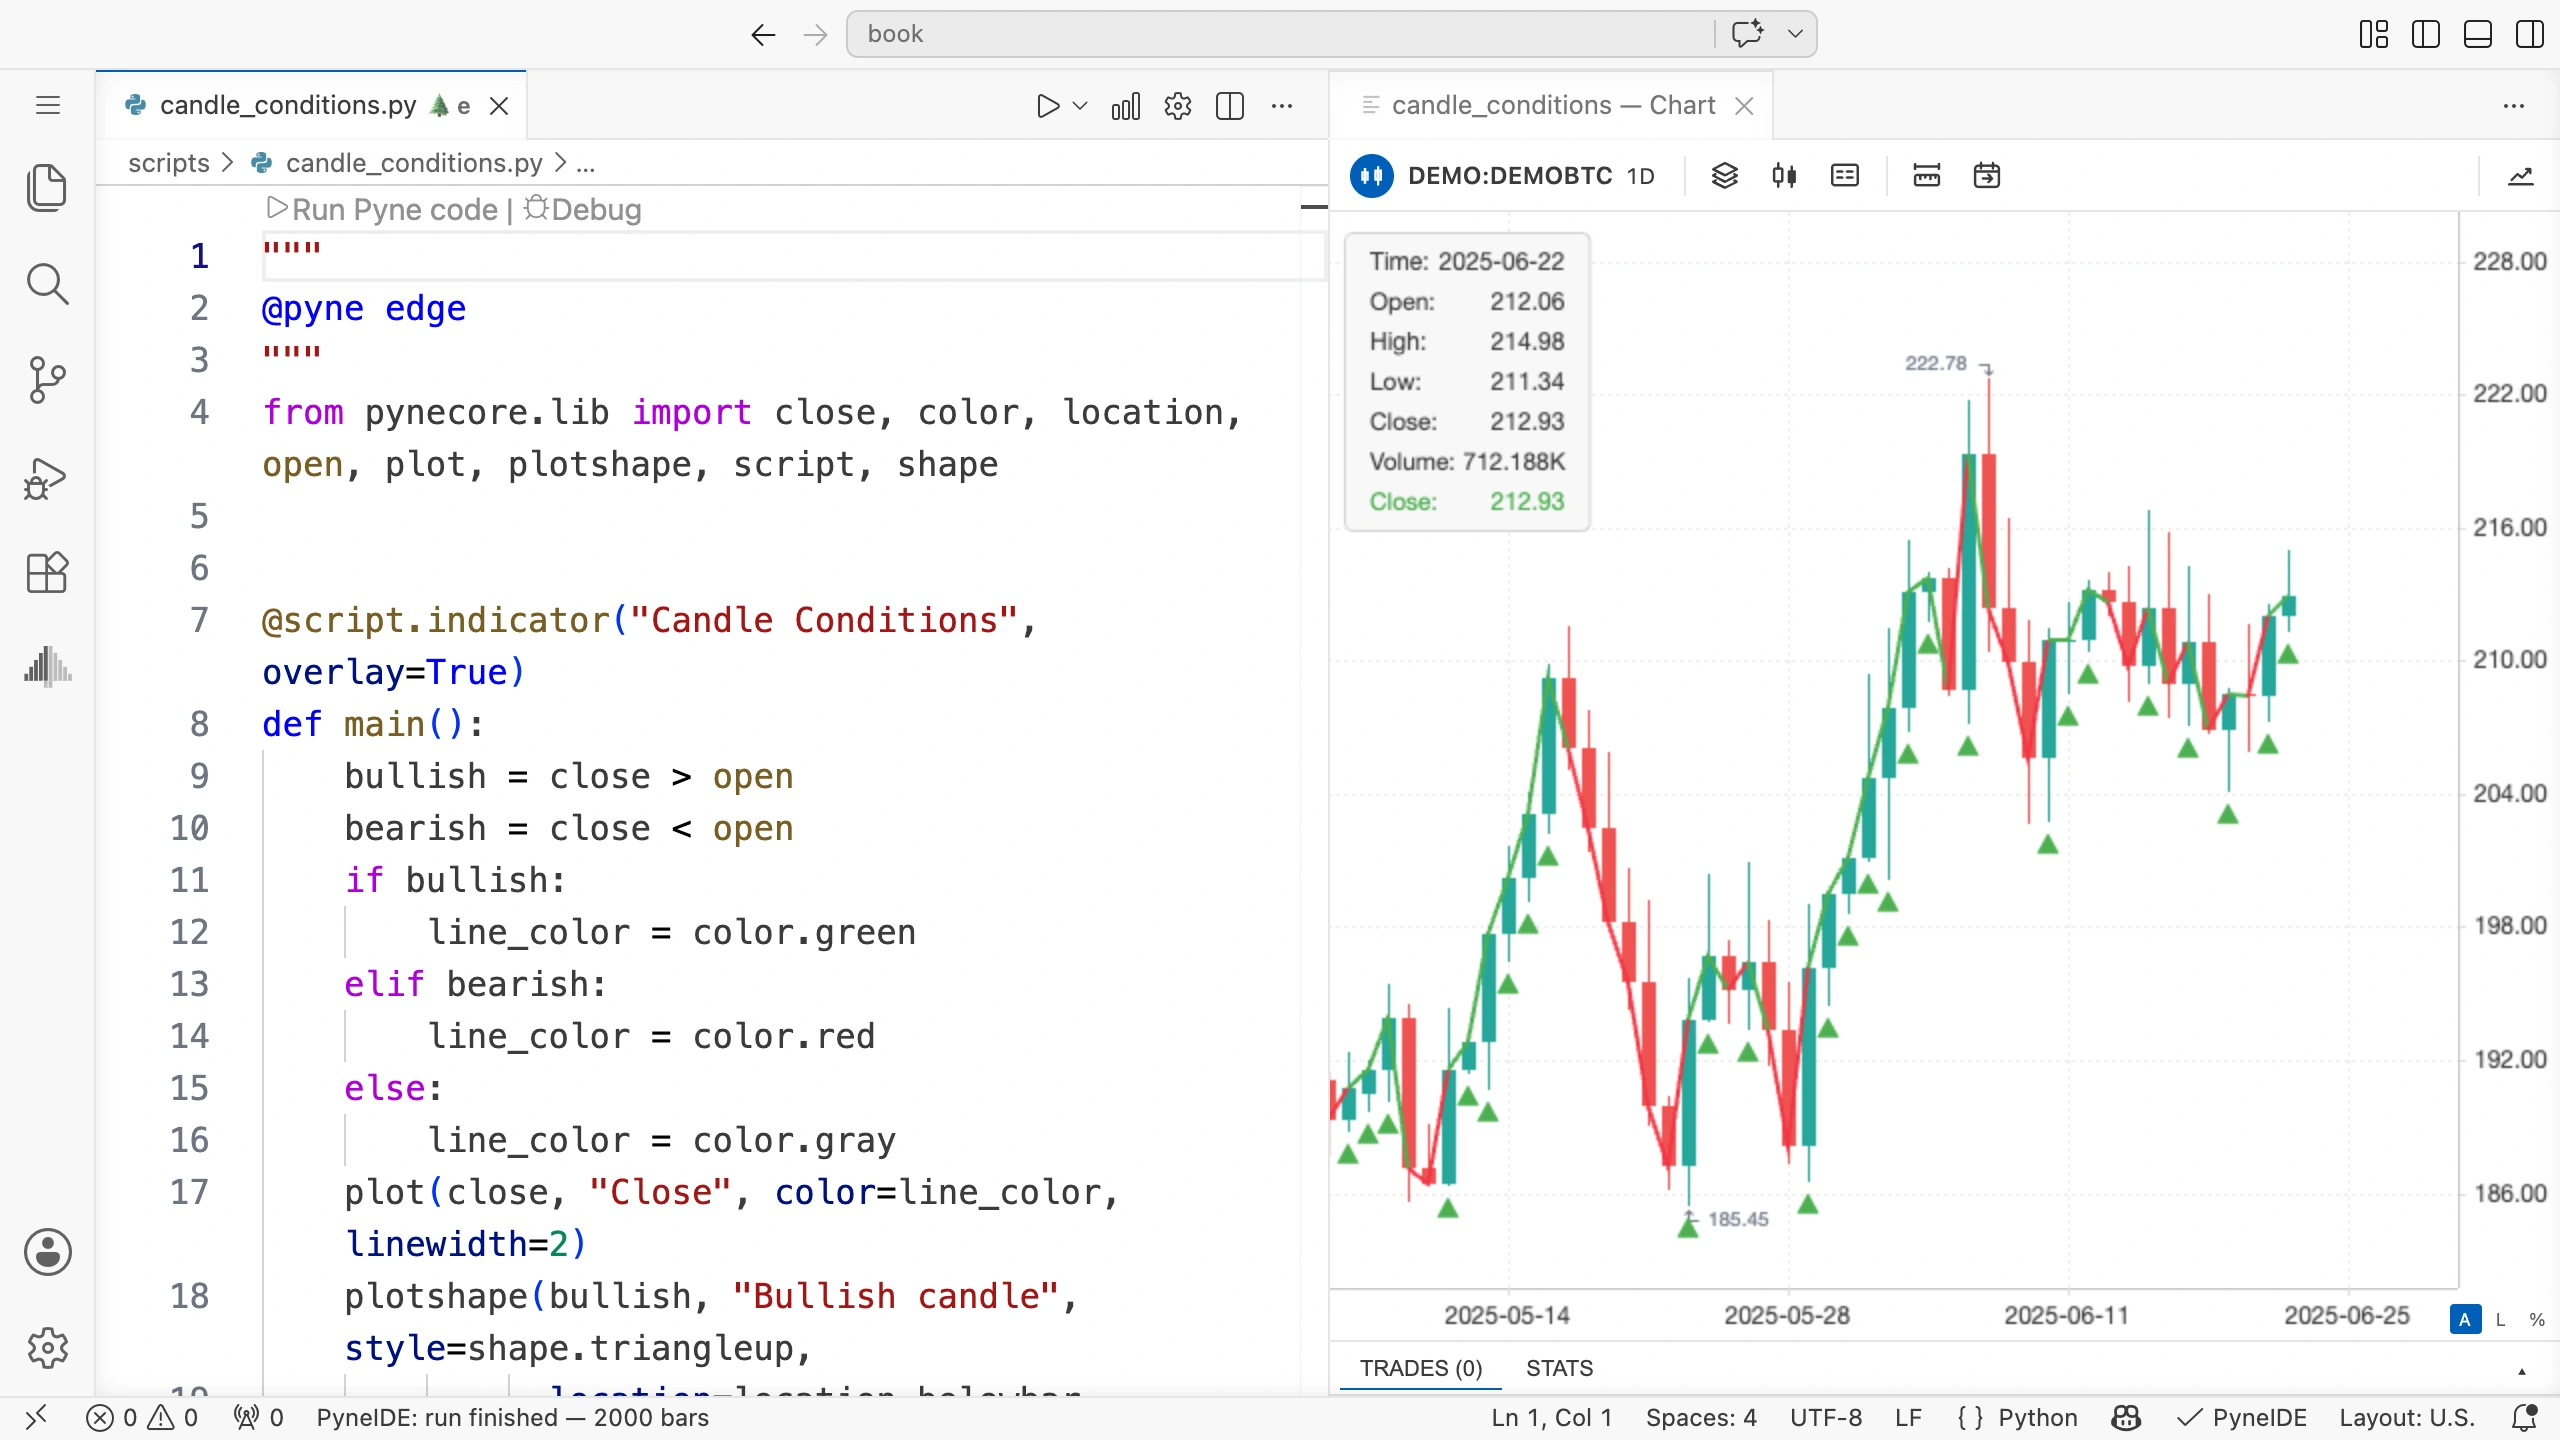
The first argument of plotshape specifies when to show the marker. style controls its shape, and location controls its position relative to the candle. Here, a marked candle simply closed above its own opening price. The marker does not imply a buy order.
You do not need to memorize these parameters either: hover over plotshape in the code to view its help. See Help while writing code for the steps and how to jump to a definition.
Where you calculate matters
plot and plotshape run on every candle. We change the value, color, or condition to display. This gives the display a result for every candle.
The same order works well for a moving average:
average = ta.sma(close, 20)
above_average = close > average
First we calculate the average on every candle. The condition then uses it. Do not put the ta.sma call inside the if bullish: branch, because it would run only on rising candles.
When the SMA is initially missing, close > average does not produce a true signal. If the code needs to respond specifically to a missing value, use na(average). average == na is not a valid missing-value check.
Combine several conditions
and is true when both sides are true. or is true when at least one side is true. not reverses a Boolean value.
strong_bullish = close > open and close > close[1]This condition requires two things at once: the candle must be rising, and its closing price must be above the previous close. A rising candle can still close below the previous candle’s close, so these are two separate conditions.
and and or short-circuit evaluation: if the first part already determines the result, the second part is not evaluated. For and, this happens when the first part is false; for or, when the first part is true. Run stateful calculations on separate lines, then combine the resulting Boolean values.
Choose a value in one expression
You can choose between two values in a single expression:
line_color = color.green if bullish else color.redThis chooses green when bullish is true, otherwise red. It would also choose red when the opening and closing prices are equal. To mark that case in gray, keep the full three-branch decision.
Try it yourself
Draw a red downward triangle above falling candles. Keep the green marker. Then make both signals stricter by also comparing with the previous closing price.
Solution
bullish_signal = bullish and close > close[1]
bearish_signal = bearish and close < close[1]
plotshape(bullish_signal, "Bullish signal", style=shape.triangleup,
          location=location.belowbar, color=color.green)
plotshape(bearish_signal, "Bearish signal", style=shape.triangledown,
          location=location.abovebar, color=color.red)
Replace the original green plotshape call with the two new calls. The color choice still looks only at the candle’s opening and closing prices. The markers now also compare with the previous closing price.
Find a candle that was skipped
Find a rising candle that did not receive a green marker in the stricter version. Check its own opening price and the previous closing price. Explain which part of the and condition failed.