From a state to an event: crossovers
Distinguish a price being above an average from the moment it crosses above it.
If the price stays above an average for ten candles, close > average can be true ten times. To mark only the event when the price moves from below to above it, you also need the relationship on the previous candle.
A situation and its beginning
Suppose the average is 100 both now and on the previous candle. The previous close was 99, and the current close is 101. On the current candle, the price is above the average and has also crossed it since the previous candle.
If the next close is 102, it is still above the average. There is no new upward crossover, however, because it was already above on the previous candle.
ta.crossover(first, second) is true when the first value is now greater than the second, and was less than or equal to it on the previous execution. ta.crossunder is its downward counterpart.
Being equal now is not yet a crossover. If the first value only reaches the second, the > condition is false. Equality on the previous candle, however, still allows the current move above it to count as a crossover.
Two moving averages crossing
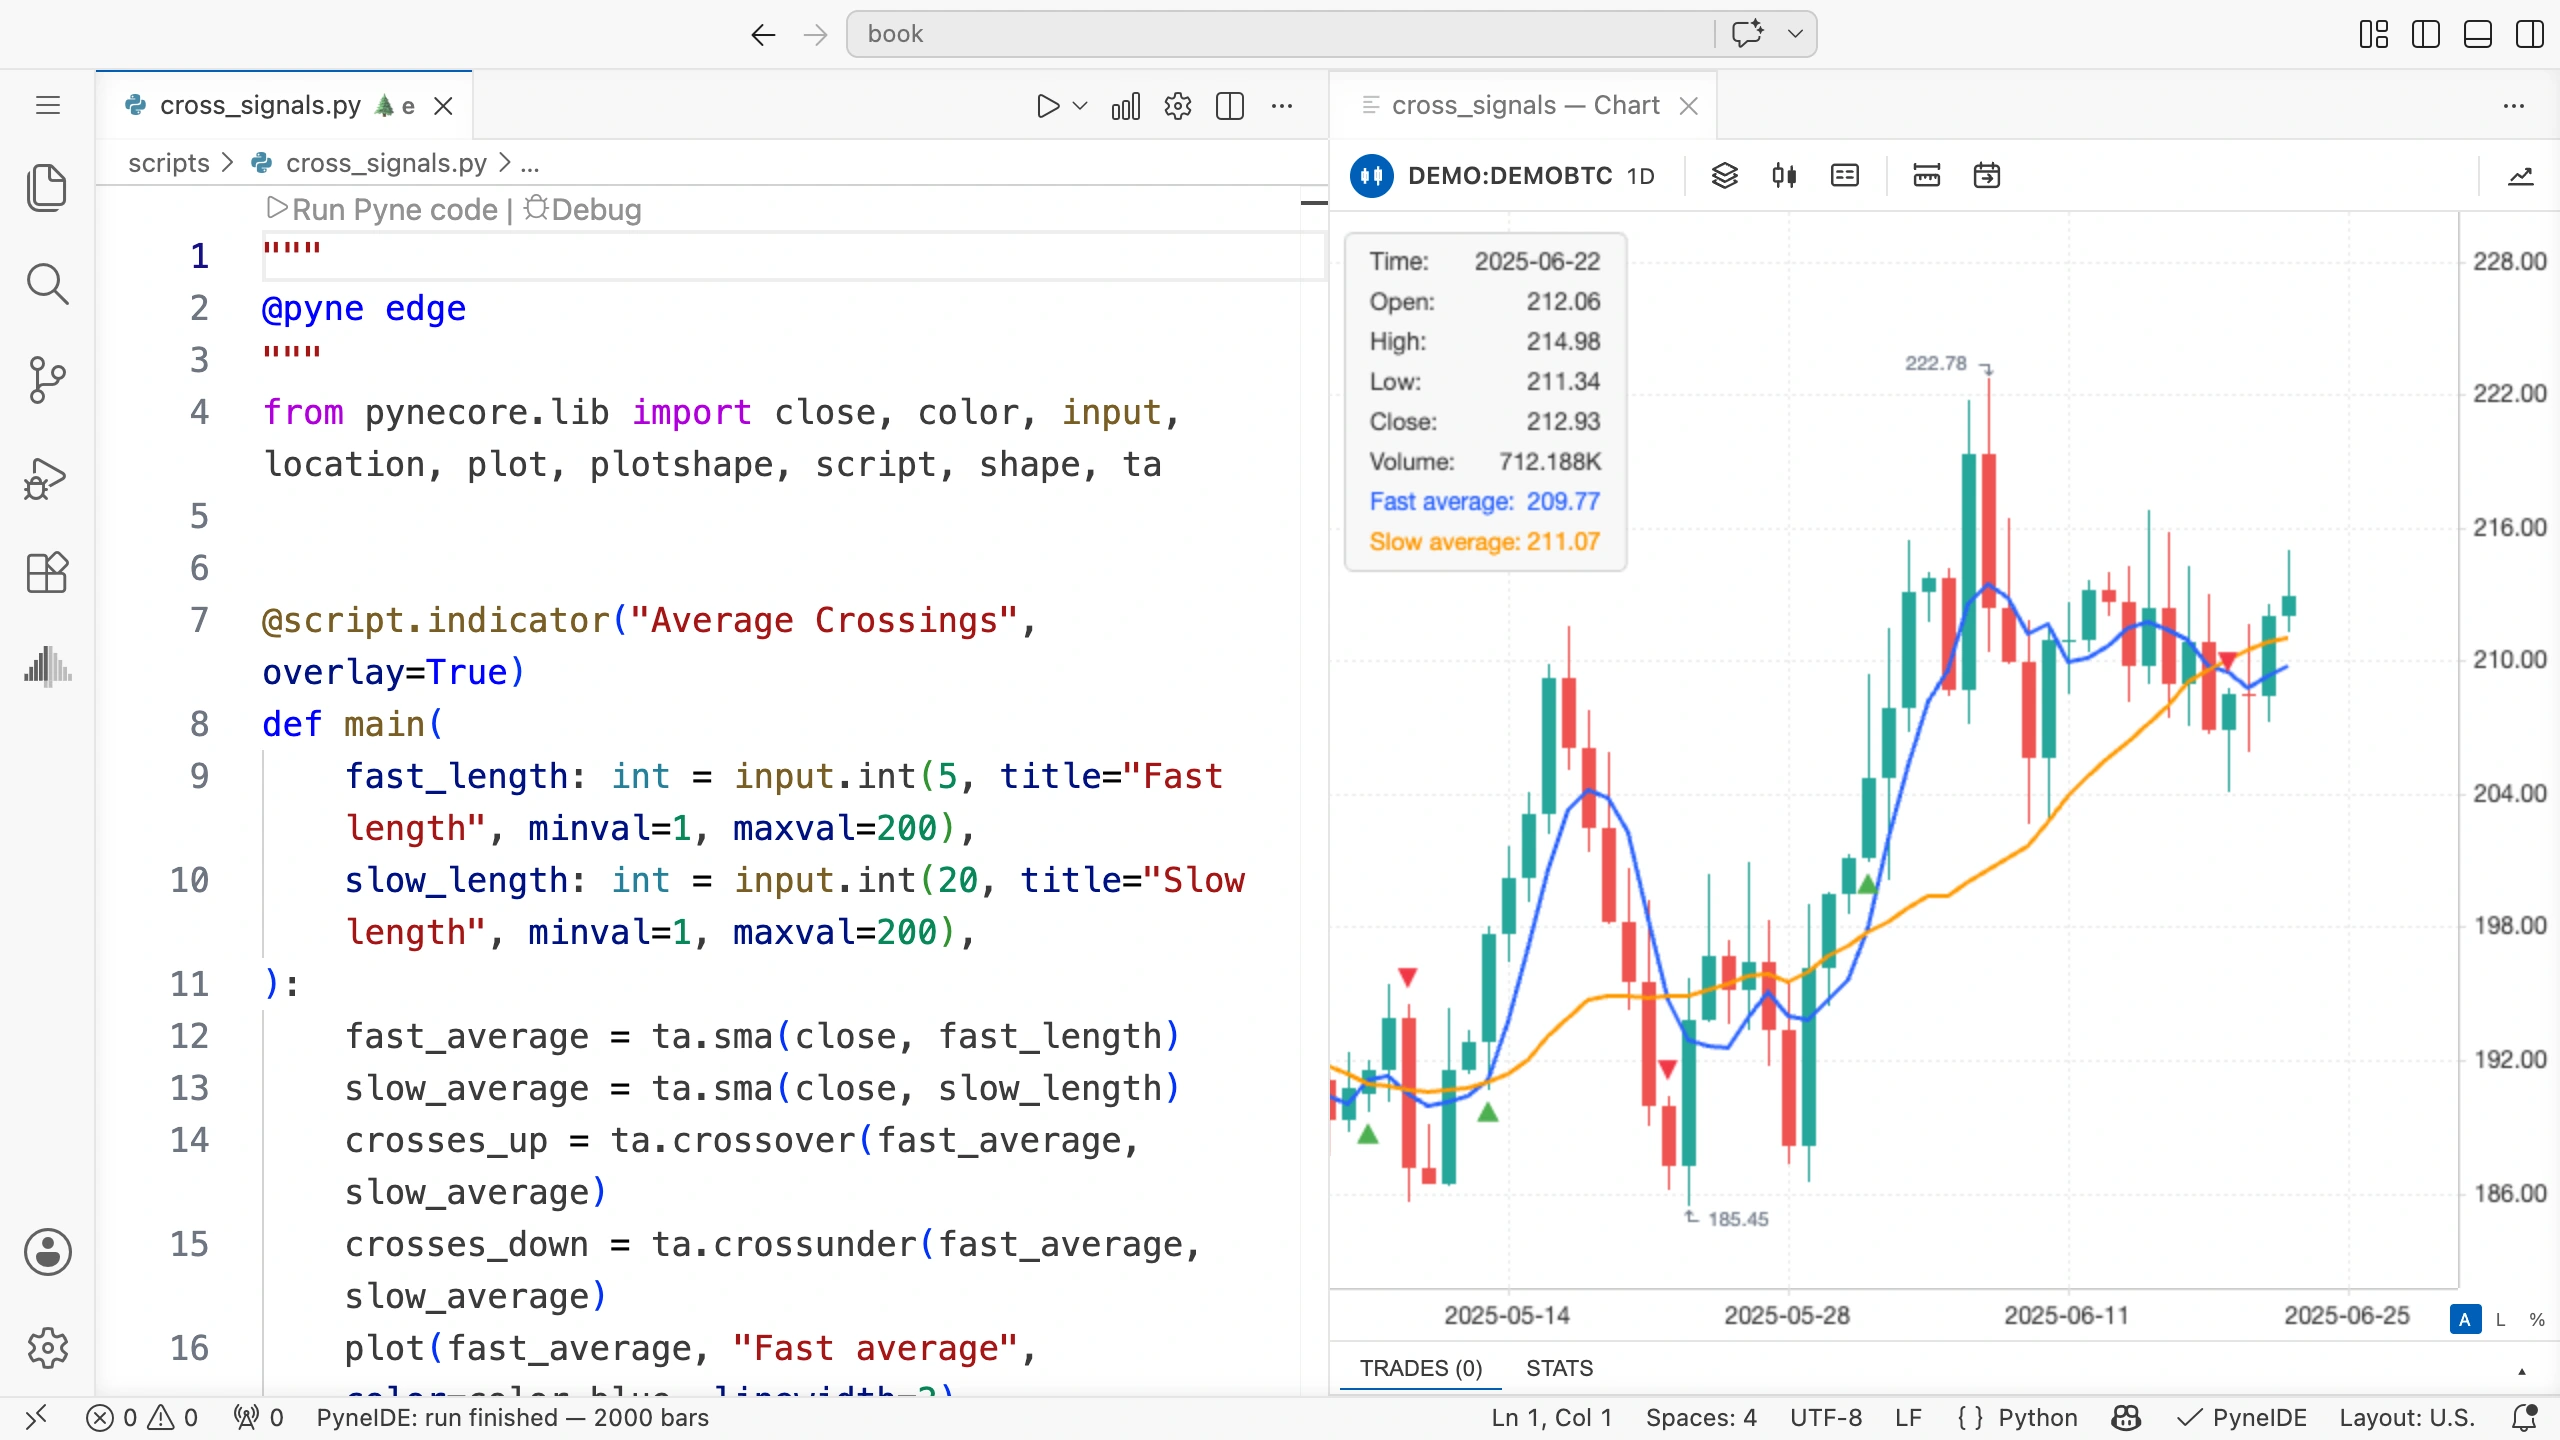
We continue with the two averages from Moving averages. The shorter, faster average will be blue, and the longer, slower one orange. A green triangle marks the fast average crossing upward; a red one marks it crossing downward.
Create cross_signals.py:
"""
@pyne edge
"""
from pynecore.lib import close, color, input, location, plot, plotshape, script, shape, ta


@script.indicator("Average Crossings", overlay=True)
def main(
    fast_length: int = input.int(5, title="Fast length", minval=1, maxval=200),
    slow_length: int = input.int(20, title="Slow length", minval=1, maxval=200),
):
    fast_average = ta.sma(close, fast_length)
    slow_average = ta.sma(close, slow_length)
    crosses_up = ta.crossover(fast_average, slow_average)
    crosses_down = ta.crossunder(fast_average, slow_average)
    plot(fast_average, "Fast average", color=color.blue, linewidth=2)
    plot(slow_average, "Slow average", color=color.orange, linewidth=2)
    plotshape(crosses_up, "Cross up", style=shape.triangleup,
              location=location.belowbar, color=color.green)
    plotshape(crosses_down, "Cross down", style=shape.triangledown,
              location=location.abovebar, color=color.red)
Run it on the demo data with the defaults of 5 and 20. Markers appear only on the candles with crossings. During a longer stretch where the blue line remains above the orange one, you do not get a new green marker on every candle.
Why calculate crossings on separate lines?
ta.crossover and ta.crossunder run on every candle. Their own previous execution therefore belongs to the previous processed candle.
If you called a crossing function only when another condition was met, its earlier state would not necessarily come from the previous candle. The plotted line and marker could be examining different time series.
We therefore follow the previous chapter’s rule: calculate the required stateful results on every candle, then make decisions from those calculated values.
Warmup matters here too
The length-twenty SMA is valid only from the twentieth candle. At its first valid value, the previous length-twenty SMA is still missing, so a crossing cannot yet be determined from two complete candles.
The condition needs both averages’ values for both the current and previous candles.
Replacing na with zero just to obtain a signal is not helpful. A zero average could create an artificial crossing at a point where the actual average cannot yet be calculated.
When the data is known
In this book, programs run on closed historical candles. A signal calculated from a daily candle’s close uses data known when that candle closes.
The closing price of a candle still forming can change. A crossing observed during the candle may disappear by its end. Keep this separate from checking closed candles.
A signal on a historical chart does not automatically have a trade executed on that same candle. The indicator draws a signal; we define orders and their fill timing when we get to strategies.
Try it yourself
Make a copy called price_crossings.py. Instead of marking the crossings of two averages, mark when the closing price crosses above or below the slow average. Keep the slow average on the chart.
Solution
crosses_up = ta.crossover(close, slow_average)
crosses_down = ta.crossunder(close, slow_average)
The markers use the two Boolean variables, so you do not need to change the plotshape lines. It is worth changing their titles to Price cross up and Price cross down, though.
If you no longer use the fast average, remove its calculation, plot, and input. The interface will then offer only the setting actually used.
Follow a crossing through
Select a candle with a green marker. Look at both lines’ values on that candle and the one before it. Describe the two comparisons that made the signal true. You can use this same check when examining a strategy.