Settings without rewriting code
Add your own input to an indicator and change it in PyneIDE’s Inputs interface.
Until now, you changed a number in the source code to try a different average length. Now you turn that number into an indicator setting. You can run the same program with different lengths.
What is an input?
An input is a named program value that can be changed from outside the code. The source code defines its type, default value, and allowed range. The user chooses a value within those limits.
Our input is named length, with a default of 20. The length variable will be the moving average’s length. The code also needs the input namespace from pynecore.lib.
length: int = input.int(20, title="Average length", minval=1, maxval=200)This line goes among the parameters of main(). int means an integer: for example, 1, 20, or 200 is allowed here, but 2.5 is not. input.int describes an integer input.
20 is the default, and Average length is the title displayed in the interface. minval and maxval are the minimum and maximum allowed values. A length of zero is not a meaningful averaging window, so we exclude it.
The complete program
Create adjustable_average.py:
"""
@pyne edge
"""
from pynecore.lib import close, color, input, plot, script, ta


@script.indicator("Adjustable Average", overlay=True)
def main(
    length: int = input.int(20, title="Average length", minval=1, maxval=200),
):
    average = ta.sma(close, length)
    plot(average, "Average", color=color.blue, linewidth=2)
We have spread the parameter list across several lines after the opening parenthesis of main. ): closes that list and starts the function body. The calculation and plotting below it begin four spaces farther in.
The comma at the end of the input line lets you add more parameters. It is also valid with just one parameter. The two indented sections have different roles: inside the parentheses, we define inputs; afterward come the statements to execute.
Run the program on the demo data. On the first run, the blue average uses twenty candles.
Open the Inputs interface
- Make
adjustable_average.pythe active file. - In the upper-right corner of the editor, click the gear icon in the toolbar beside the file tab. Hovering over it shows Edit Inputs….
- Find the Average length field in the interface that opens.
- Change its value to 5, then click Save.
You can open the same interface from the Scripts group in the Pyne view on the left: right-click adjustable_average.py and choose Edit Inputs…. It is also available in the context menu when you right-click the open code.
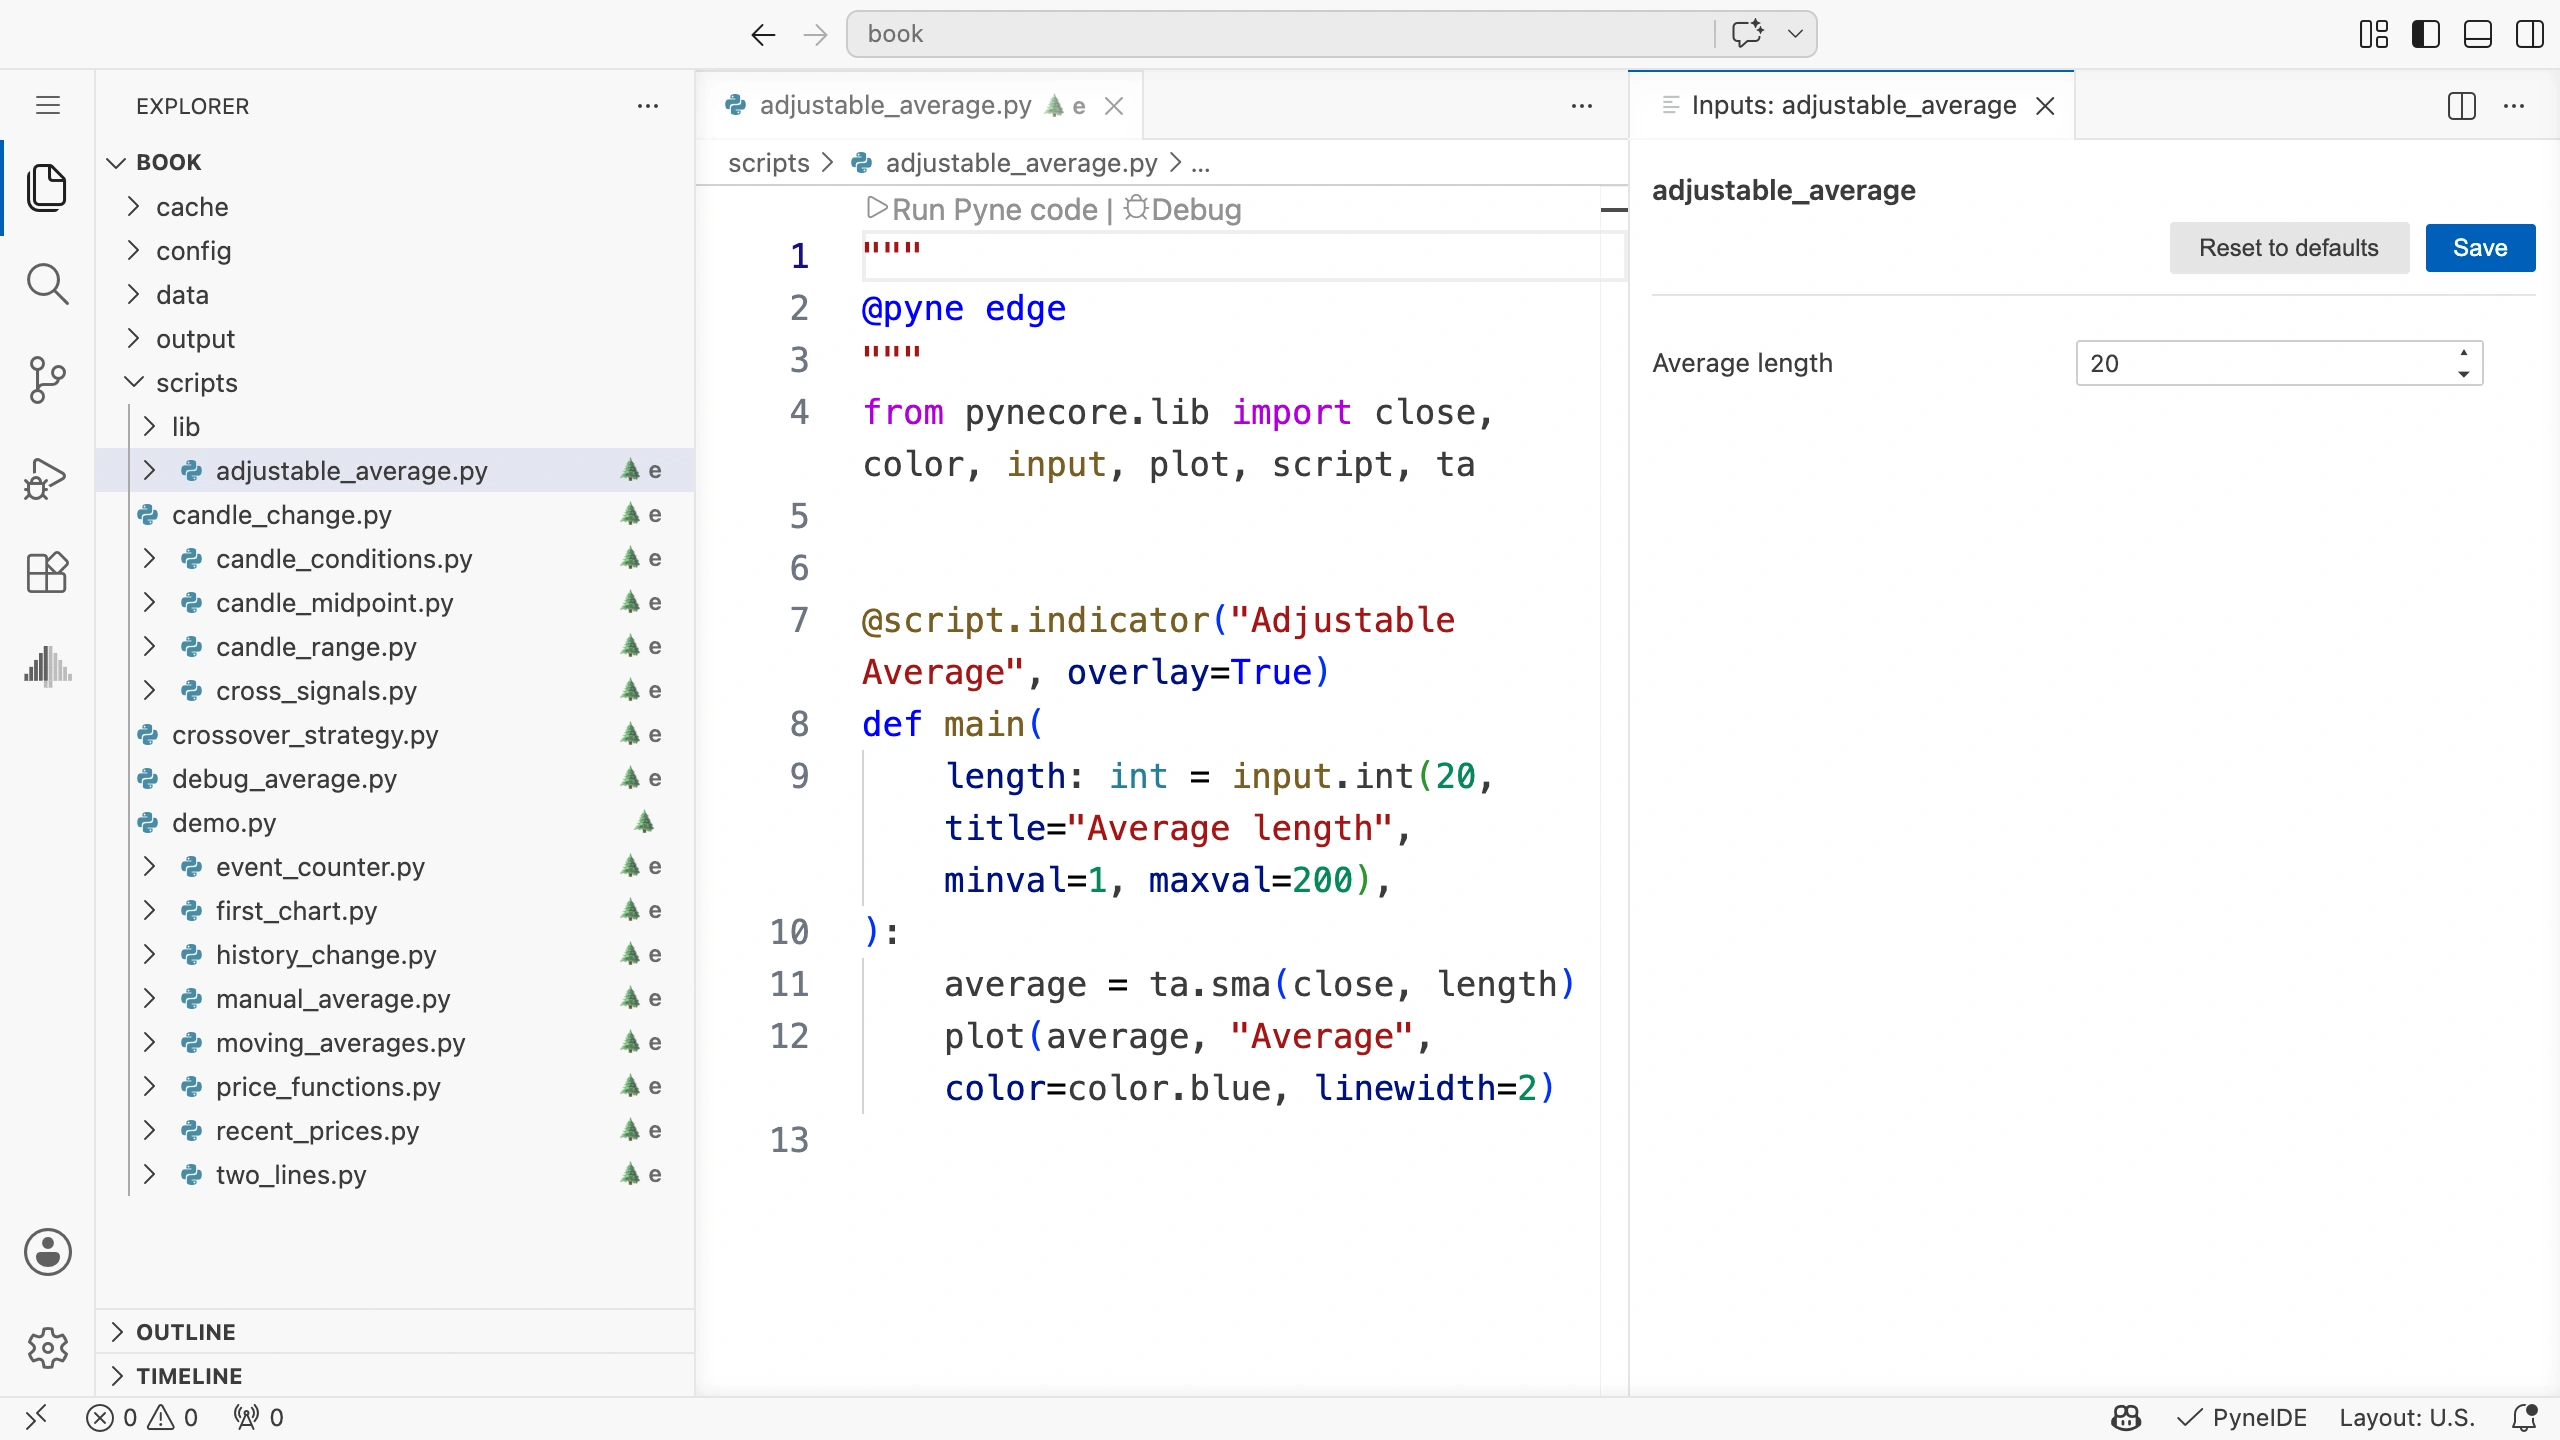
When you click Save, PyneIDE automatically recalculates the open chart with the saved setting. Wait for the update: the blue line now shows a five-candle average.
The source still has a default of 20. The value of 5 saved in Inputs overrides it in this project.
Now set it to 50 and save again. Compare how the line responds to price changes over the same period. Moving to a different period on the chart alone does not change the program’s input.
Where is the setting stored?
A .toml file with the same name beside the program stores the saved settings. For this example, it is adjustable_average.toml.
TOML is a text-based configuration format. PyneIDE manages this file, so the Inputs interface is all you need for the exercise. If you open the file, the length setting looks like this:
[inputs.length]
value = 5
Square brackets identify a settings group here. This is not the candle history you learned about in the chapter on history: it appears in a different file, following a different language’s rules.
The parameter’s name in code and its interface title are different too. The file uses length; the interface shows Average length. The name in the code is what matters to the program.
If you rename an input in the source, a value saved under the old name is not a setting for the new input. In that case, reopen Inputs and check the value. When copying a program, copy its neighboring .toml file only if you want to keep its saved settings too.
Default value and actual value
If you change the default in the code from 20 to 30 but have already saved a value of five, the run may use five. The saved override takes priority.
When describing a result, record the actual input. The default visible in the source does not, by itself, describe every setting used in the run.
Try it yourself
Add a second length parameter to the indicator. Give the short average a default of 5 and the long one a default of 20. Both must allow values from 1 to 200. Plot them with separate titles.
Solution
The parameter list of main():
fast_length: int = input.int(5, title="Fast length", minval=1, maxval=200),
slow_length: int = input.int(20, title="Slow length", minval=1, maxval=200),
The body:
fast_average = ta.sma(close, fast_length)
slow_average = ta.sma(close, slow_length)
plot(fast_average, "Fast average", color=color.blue, linewidth=2)
plot(slow_average, "Slow average", color=color.orange, linewidth=2)
The two inputs can be changed independently. The specified limits do not yet require the fast length to be smaller than the slow one. That relationship needs a separate check; we cover it in the final project.
Check that it was saved
Set the length to one. A one-candle SMA is that candle’s closing price, so the line should pass through the closing prices. Then set it back to twenty. When you reopen the file, check that the interface shows the saved value of twenty.