What the program remembers
Count crossings with a Persistent variable and distinguish state from history.
A crossing marker shows where an event happened. To know how many such events have occurred since the start of the data, the program needs to remember a counter’s value.
Why is an ordinary variable not enough?
These two lines restart the count on every candle:
count = 0
count += 1
The first line sets the variable to zero every time main() runs. The second adds one, so the final result is 1 on every candle.
+= is a shortened assignment: count += 1 expresses the same thing as count = count + 1. It reads the old value, adds one, and puts the result back into the variable.
Counting events needs a different start. We want to reset to zero only when the counter is first created.
The Persistent variable
count: Persistent[int] = 0The Persistent annotation says to keep the variable’s value between candles. The initial zero sets the variable once. On the next candle, we continue with the value retained from the previous closed candle.
Here, int specifies that the counter has an integer type. We import Persistent from pynecore, just as we imported Series earlier.
This annotation does not save data to disk. A new run starts at the beginning of the data again, with a zero counter. We are talking about retaining values between candles within the program.
Count upward crossings
Create event_counter.py:
"""
@pyne edge
"""
from pynecore import Persistent
from pynecore.lib import close, color, plot, script, ta


@script.indicator("Crossing Counter", overlay=False)
def main():
    fast_average = ta.sma(close, 5)
    slow_average = ta.sma(close, 20)
    crosses_up = ta.crossover(fast_average, slow_average)
    count: Persistent[int] = 0
    if crosses_up:
        count += 1
    plot(count, "Crossing count", color=color.blue, linewidth=2)
Run it on the demo data. The counter in the separate panel starts at zero. It increases by one whenever an upward crossing occurs and stays unchanged on the candles between them.
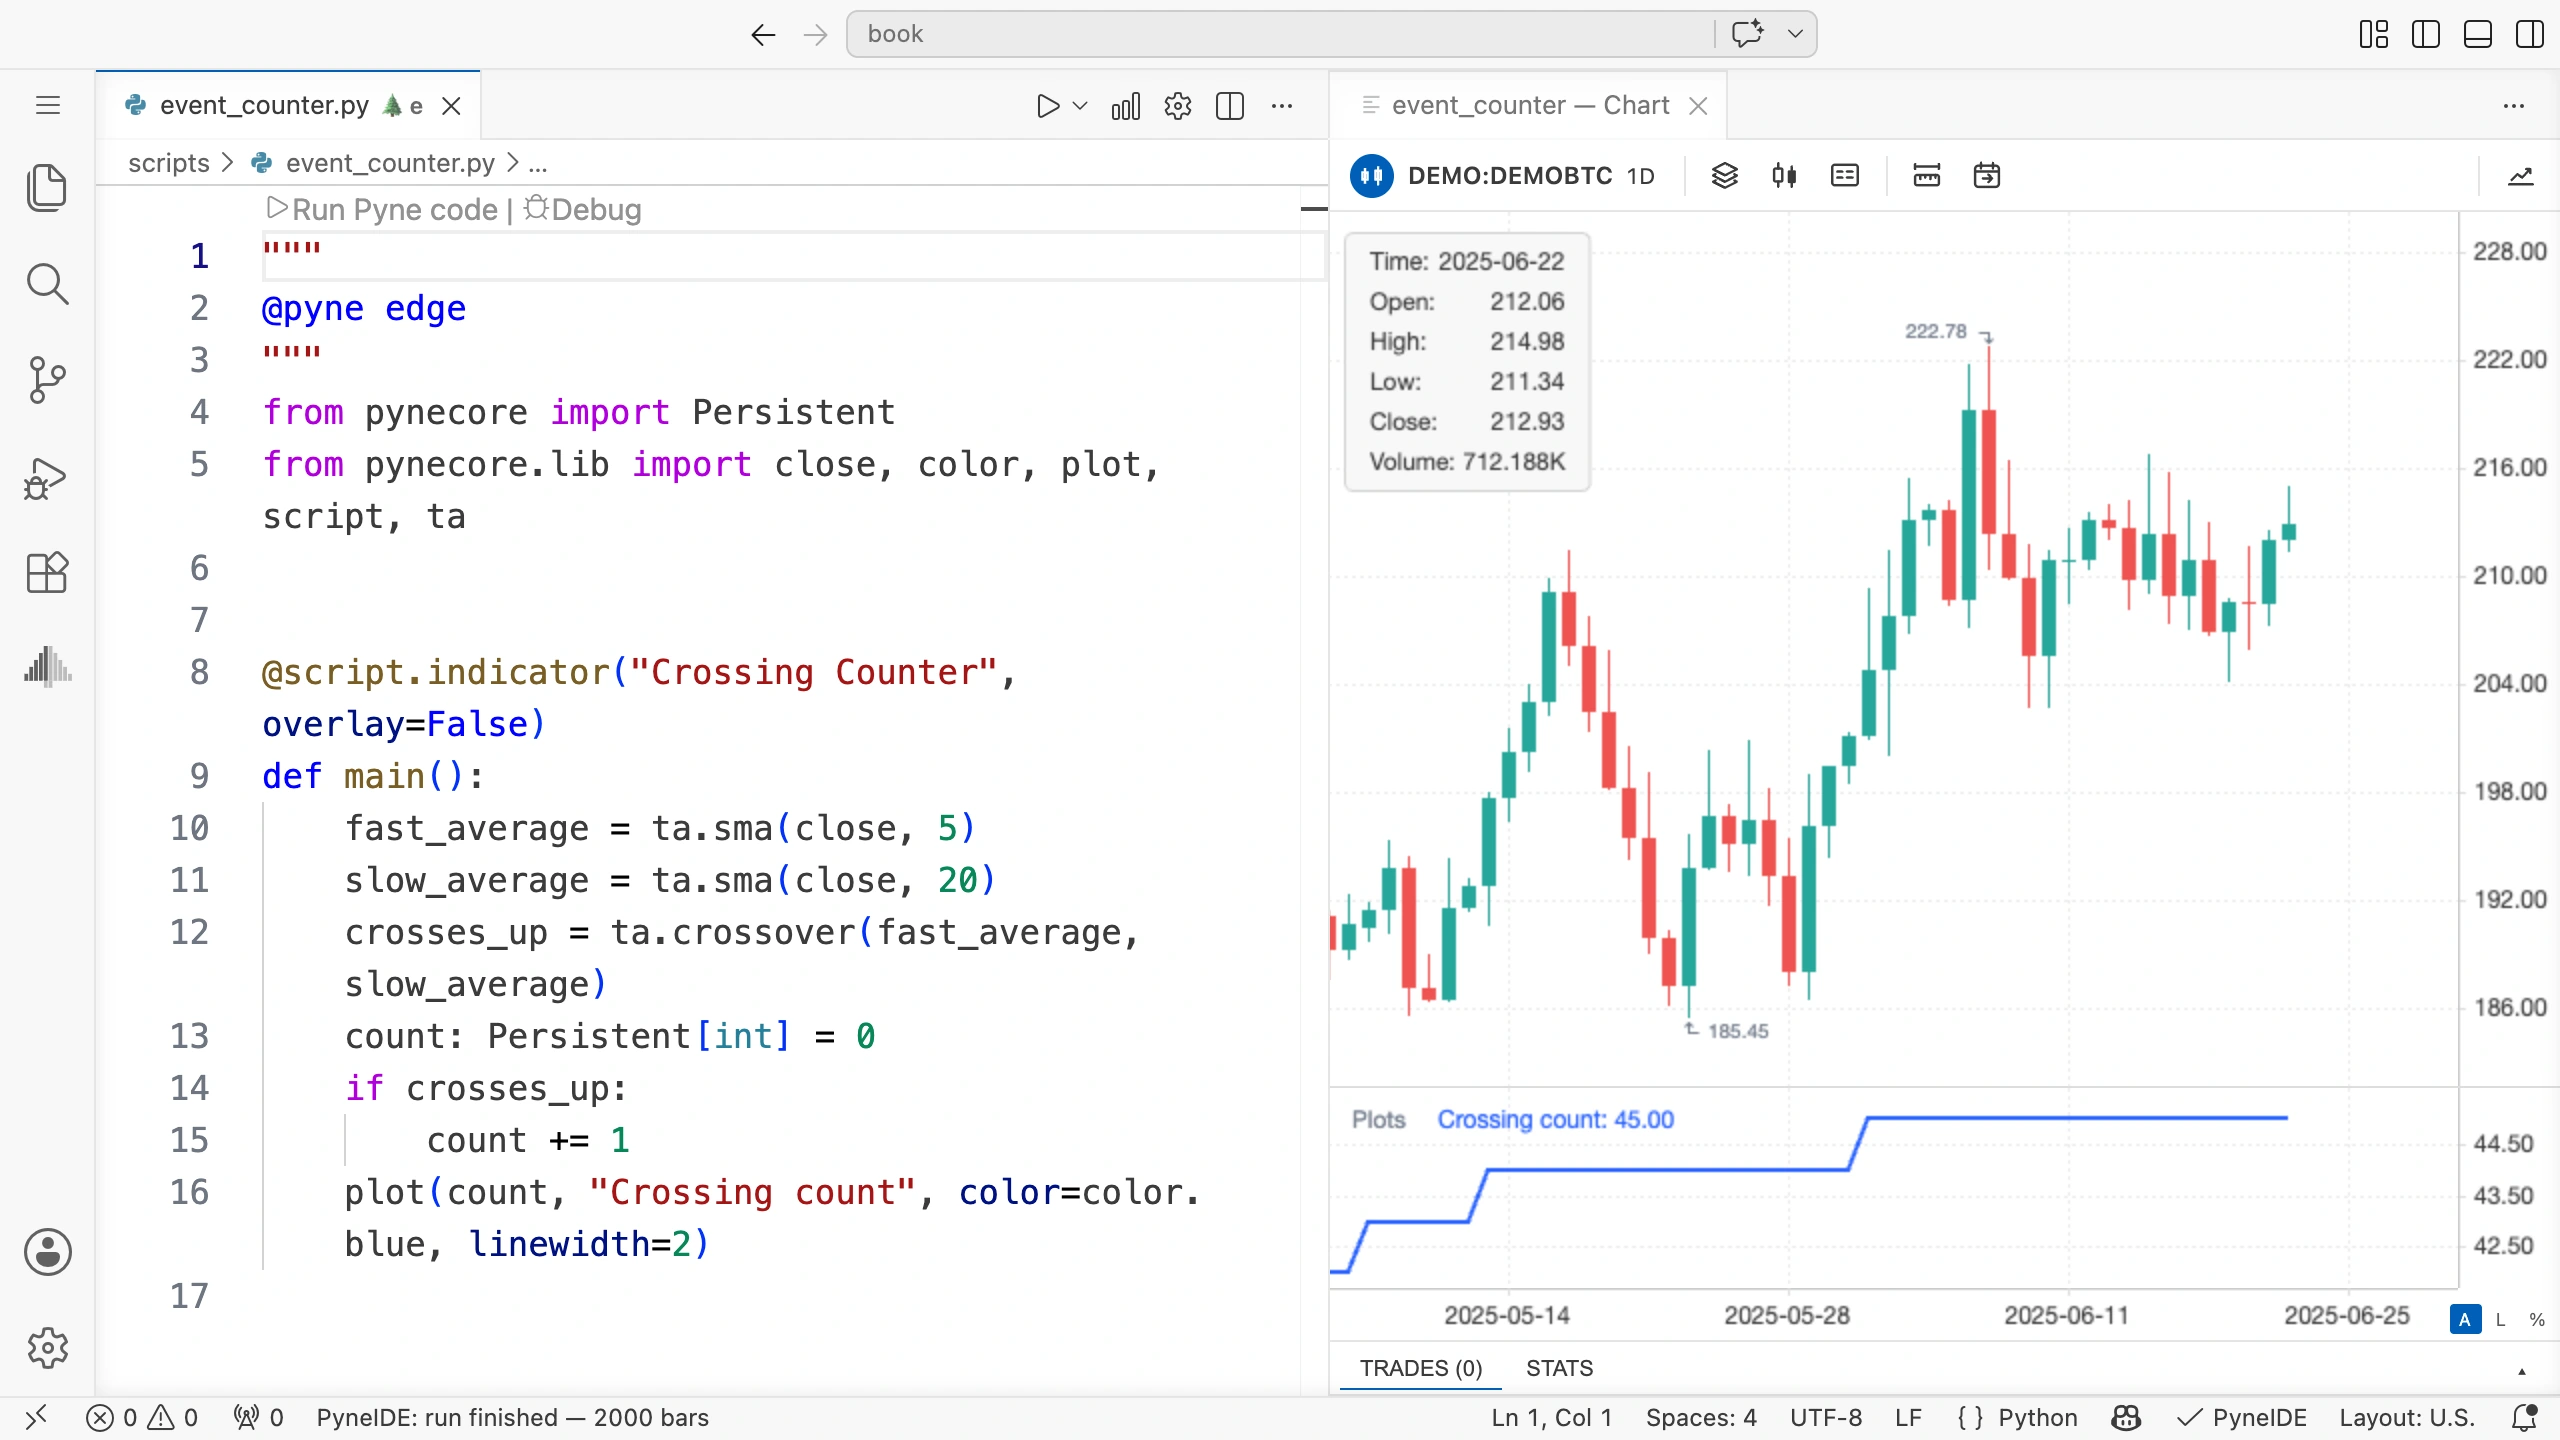
If the last chart value is 12, for example, that means twelve upward crossings occurred across all the processed data. The short period visible on the screen may have fewer signals. Zooming the chart does not restart the counter.
State and history
The two annotations serve different purposes:
| Annotation | What do we ask the runtime to do? |
|---|---|
Series[float] | Make the value’s history available for each candle |
Persistent[int] | Start the next candle with the variable’s stored value |
A Series variable’s assignment runs on every candle, and the resulting values form a history. A Persistent variable’s initial assignment happens only once; afterward, changes made by the code carry its state forward.
To look back directly at an earlier counter value, you can put the current counter value in a separate Series variable. Retaining a value and indexing past values are two different concerns.
Where to put a retained variable
We declare the counter before the condition, where it is available on every candle. It therefore has a value even without the condition, and plot can display it on every candle.
Do not create an ordinary mutable global counter above main(). Describe state between candles with the annotation, where the program uses it.
The historical run examined here calculates once per candle. In execution modes that evaluate a candle more than once, Persistent starts again from the previous closed candle’s state. It therefore does not store the number of all technical executions. We use the book’s counter for events on closed candles.
A condition can reset the value too
If you count successive rising candles, you can reset the count on a falling candle or one with equal opening and closing prices:
if close > open:
    streak += 1
else:
    streak = 0
You must create streak beforehand with a Persistent[int] annotation. Here, resetting is a deliberate conditional operation. It does not happen automatically at the start of every candle.
Try it yourself
Add a second retained counter to the program. It should count downward crossings and appear as an orange line. Run both calculations on every candle.
Solution
Alongside the upward-crossing calculation:
crosses_down = ta.crossunder(fast_average, slow_average)
down_count: Persistent[int] = 0
if crosses_down:
    down_count += 1
plot(down_count, "Downward count", color=color.orange, linewidth=2)
Keep the existing count variable and its plot. The two counters are independent. A new run builds both from zero.
Check at a signal
Compare the markers from the chapter on crossings with the counter’s changes on the same data. On the upward-crossing candle, the counter should increase by exactly one. It can increase again on the next candle only if another upward crossing occurs.