Loops within a candle
Calculate a moving average with your own loop and compare it with the built-in function’s result.
The runtime steps through the sequence of candles. Within a single candle, however, you may need repetition yourself: for example, to add the last five closing prices. You can use a loop for this.
for and range
for offset in range(5):
    total += close[offset]
With range(5), the loop gives offset the values 0, 1, 2, 3, and 4 in order. It does not include 5. The indented line runs once for each value.
close[offset] therefore means the current close first, then the closes one, two, three, and four candles earlier. We add exactly five values.
You must set total to zero before the loop. It is an intermediate result for one candle’s calculation, not a counter retained between candles.
range(1, 5) produces a different sequence: 1, 2, 3, 4. The start is included; the end is not. If you leave out the start, the sequence begins at zero.
A moving average written by hand
Create manual_average.py:
"""
@pyne edge
"""
from pynecore.lib import close, color, input, plot, script, ta


@script.indicator("Manual Average Check", overlay=False)
def main(
    length: int = input.int(5, title="Length", minval=1, maxval=100),
):
    total = 0.0
    for offset in range(length):
        total += close[offset]
    manual_average = total / length
    builtin_average = ta.sma(close, length)
    difference = manual_average - builtin_average
    plot(difference, "Difference", color=color.blue)
Run it on the demo data. The line shows the difference between your own average and the built-in SMA. After warmup, it should stay at zero or very close to zero due to numerical representation.
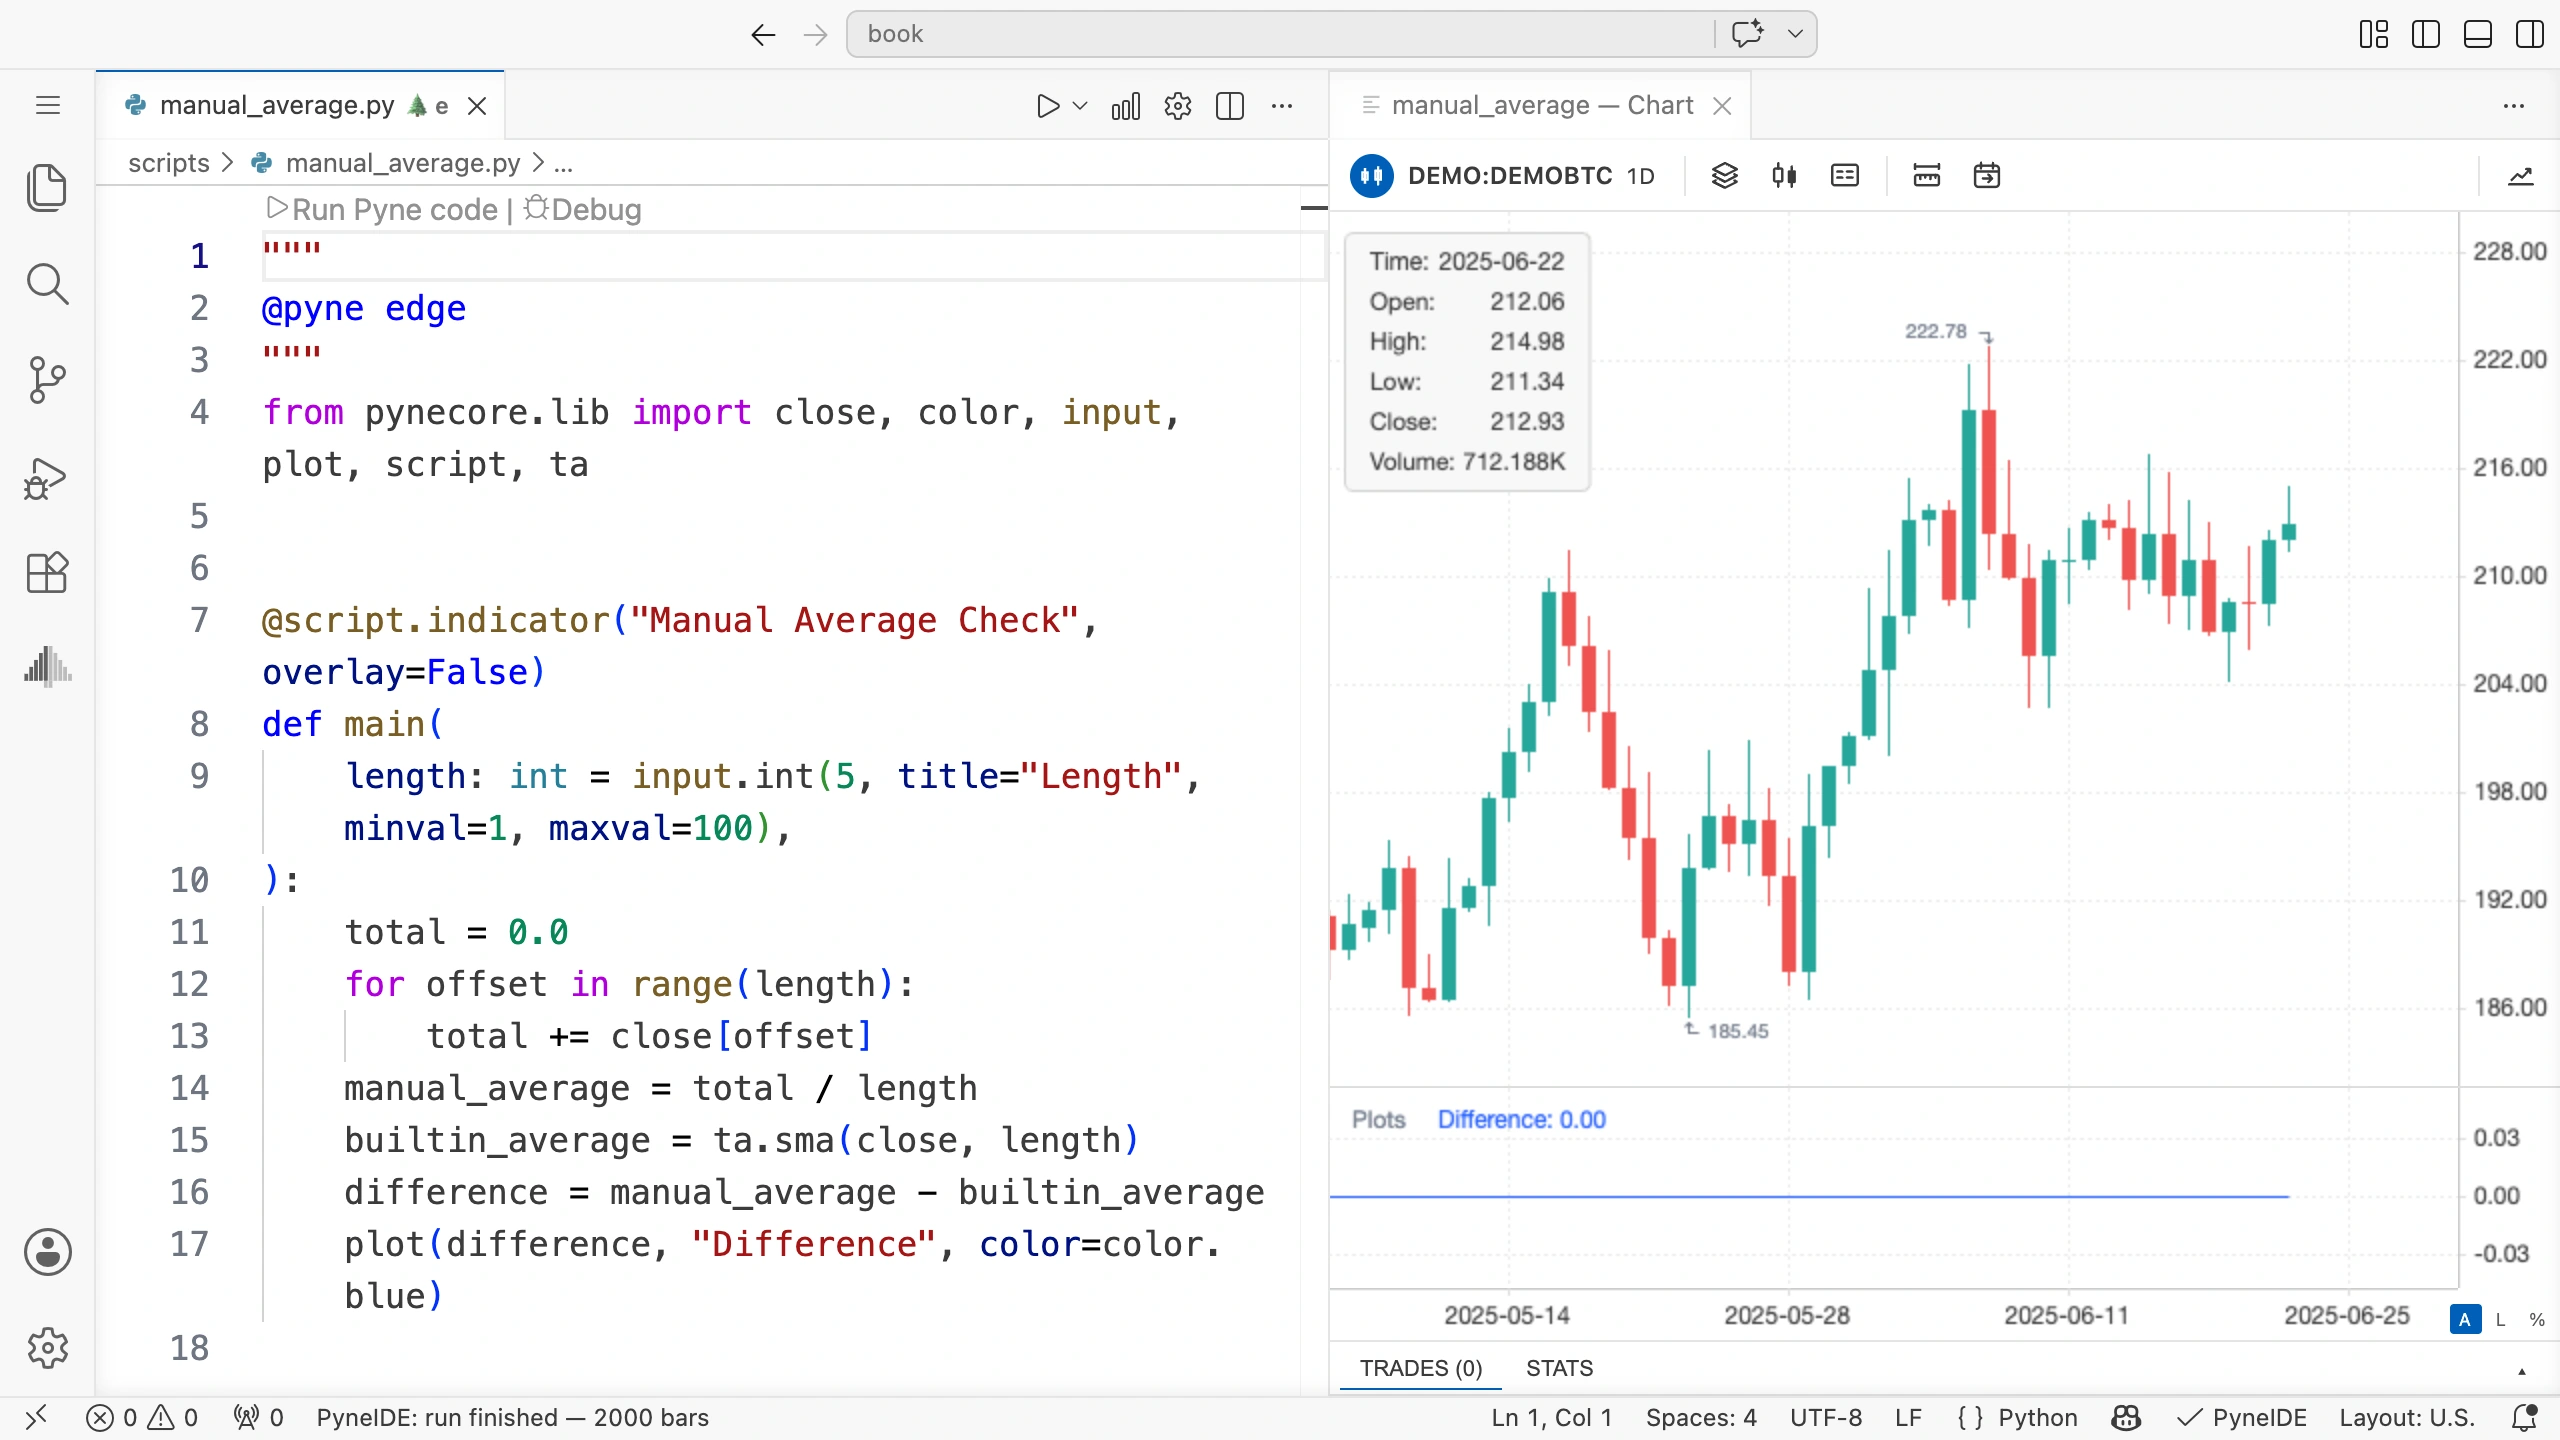
We plot the difference because small discrepancies are hard to spot in two overlapping lines. It directly shows whether the calculations agree.
What does one execution do?
With a length of five, the steps are:
totalbecomes zero.- The loop adds the current close and the previous four closes.
- We divide the sum by five.
- We also calculate the built-in SMA and compare the two results by subtraction.
- We draw a single point on the difference line.
The runtime then moves to the next candle. There, total starts at zero again, and the loop adds the five values belonging to the new candle.
If you changed total to a Persistent type, the next candle would continue from the previous sum. On every candle, you would add another five values to the old result, and would no longer be calculating the current window’s average.
Missing history
On the first four candles, at least one close is missing from the five-element window. An na in the sum also makes your average missing. The built-in length-five SMA becomes valid only on the fifth candle too.
All closing prices in the book’s demo data are valid. For a source with missing values in the middle too, the built-in ta.sma may handle missing data differently from a simple sum over candle offsets. We therefore check this example on the data specified here.
How much repetition are you requesting?
With a hundred-candle window, we perform a hundred additions per candle. Across two thousand candles, that is two hundred thousand loop iterations.
The built-in ta.sma handles this common task with a runtime calculation designed for it. The custom loop here helps you understand and compare the calculations. Use the built-in function when it does the job you need.
The loop must have a known, bounded end. The input’s maximum also limits how much work a user can request within one candle.
break and continue
break exits the loop. continue skips the rest of the current iteration and jumps to the next one.
Use these carefully in an averaging window. If you add three values and then stop, you cannot divide the sum by five as though it contained five values. Skipping values changes the calculation’s meaning.
Try it yourself
Set the length to three. For one candle, write down the offsets used in the loop and the three prices they refer to. Then change the program to plot your average and the built-in average in overlay mode as well as calculating the difference.
Solution
The three offsets are 0, 1, and 2. The decorator needs overlay=True, followed after the calculation by:
plot(manual_average, "Manual average", color=color.blue, linewidth=2)
plot(builtin_average, "Built-in average", color=color.orange)
Remove the difference plot from this view. A line around zero and averages at the price level are hard to read on a shared scale. You can keep the original difference panel in a separate program version for checking.
Find a shifted window
Think about what would change if you wrote the loop as range(1, length + 1). There would still be five elements, but the current candle would be left out and the candle five steps earlier would be included. This would be the previous candle’s averaging window, not the current one’s.