Exits and position size
Add stop and target exits to a strategy and check distances specified in ticks.
The first strategy closed only at an opposite crossing. Now we also use loss and profit distances measured from the entry price. The earlier crossing-based close remains.
Three different reasons to exit
Three events can close the long position in this example:
- the price reaches the stop-loss order’s level;
- the price reaches the profit-taking limit order’s level;
- the fast average crosses below the slow one and the market close fills.
Stop and limit orders have price conditions. strategy.close submits a market closing order. Their fill rules can differ, so you need to check both price and time in the trade table.
A distance or a specific price?
The strategy.exit call allows two ways to specify exits:
| Argument | What do you specify? |
|---|---|
loss | Loss distance in ticks |
profit | Profit distance in ticks |
stop | A specific stop price |
limit | A specific limit price |
loss=100 does not mean 100 percent or necessarily 100 units of currency. You are requesting a distance of a hundred ticks from the entry price.
DEMO’s tick size is 0.01. A hundred ticks is therefore 1 price unit, and two hundred ticks is 2 price units. For a long entry at 200, these mean a stop at 199 and a target at 202, before any further effects of slippage and fill conditions.
The complete program
Create protected_strategy.py:
"""
@pyne edge
"""
from pynecore.lib import close, color, input, plot, script, strategy, ta


@script.strategy(
    "Crossing Strategy with Exits",
    overlay=True,
    initial_capital=10000,
    default_qty_type=strategy.fixed,
    default_qty_value=1,
    pyramiding=1,
    commission_type=strategy.commission.percent,
    commission_value=0.1,
    slippage=2,
)
def main(
    fast_length: int = input.int(5, title="Fast length", minval=1, maxval=200),
    slow_length: int = input.int(20, title="Slow length", minval=1, maxval=200),
    stop_ticks: int = input.int(100, title="Stop distance (ticks)", minval=1),
    target_ticks: int = input.int(200, title="Target distance (ticks)", minval=1),
):
    fast_average = ta.sma(close, fast_length)
    slow_average = ta.sma(close, slow_length)
    crosses_up = ta.crossover(fast_average, slow_average)
    crosses_down = ta.crossunder(fast_average, slow_average)
    if crosses_up:
        strategy.entry("Long", strategy.long)
    if crosses_down:
        strategy.close("Long")
    strategy.exit("Bracket", "Long", loss=stop_ticks, profit=target_ticks)
    plot(fast_average, "Fast average", color=color.blue, linewidth=2)
    plot(slow_average, "Slow average", color=color.orange, linewidth=2)
Bracket identifies the exit order group. The second argument, Long, specifies which entry it is associated with. loss and profit use the two inputs above.
We execute the exit call on every candle with the same identifier. It manages the specified exit rule; it does not open a separate, independent full position on every call.
Run the program on the demo data. Trades may now show Bracket exits as well as crossing-based market closes.
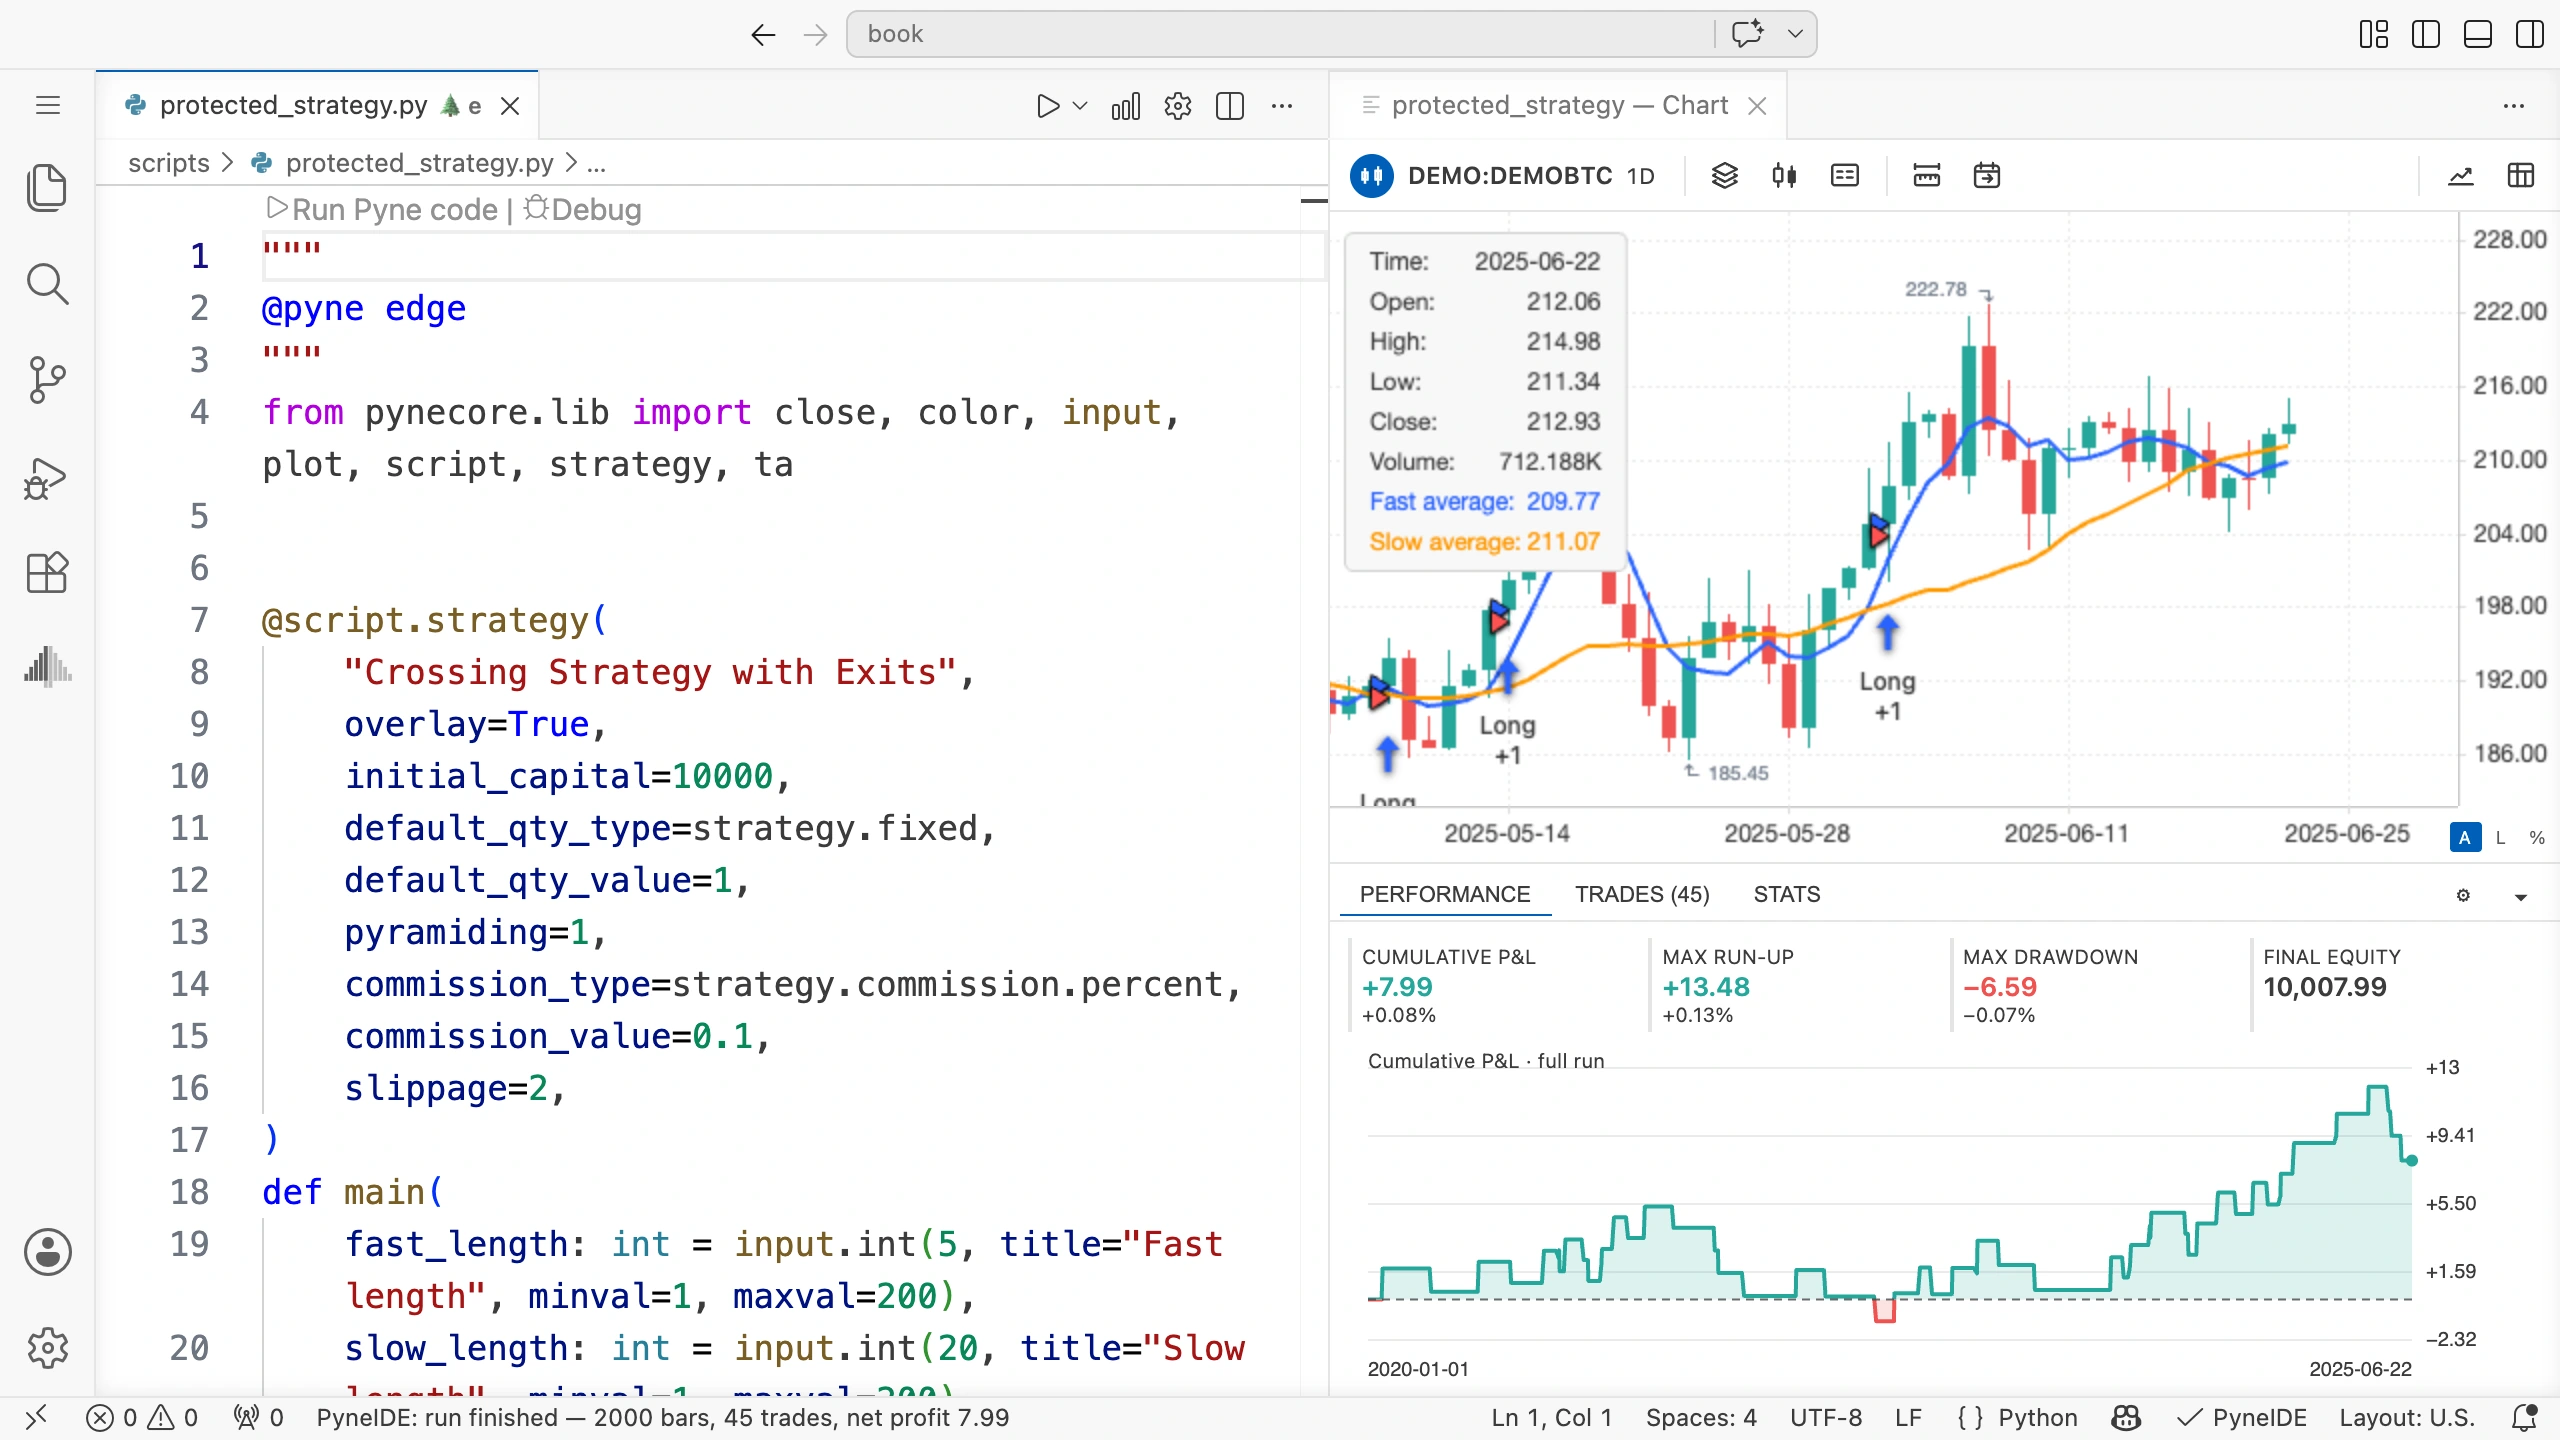
When does the protective exit appear?
The program can issue an entry instruction and an associated exit instruction in the same execution. The runtime can connect the distance specified in ticks to the entry’s actual fill price.
If you instead calculated a specific stop price from the signal candle’s close, that level would start from the signal price. If the next opening price differs, it would no longer be the same distance from the actual entry.
Choose the form according to the rule you want to express. loss is a tick distance relative to entry; stop is a specific price level.
A candle does not contain every price step
OHLCV data gives us a candle’s open, high, low, and close. It does not automatically reveal the time order of every price within the candle.
If the same candle’s high reaches the target and its low reaches the stop, the four prices alone do not tell us which happened first. The simulator uses its fill model’s rules in that case. Lower-timeframe data can allow a more detailed examination.
Check this case separately; do not manually choose the more favorable outcome every time. The model’s assumption is part of the result.
A stop price does not guarantee an exact fill price either. If the next candle opens beyond the stop, the fill can be worse than the level skipped by the gap. Slippage can add another price difference.
Distance and monetary loss
For a one-unit long position with a point value of 1, a hundred ticks at a tick size of 0.01 means a price difference worth 1 unit of currency. With ten units, the same move produces ten times the price-based result.
Quantity, tick size, and point value together determine the monetary size of the move to the stop. Commissions and actual fill conditions also contribute.
If you specify qty directly in an order, it is that order’s own quantity. The example uses the default quantity, which can also be overridden in Properties → Order size.
The 100- and 200-tick settings in the DEMO exercise are for illustration. On another instrument, the same numbers can mean different price and monetary distances.
Try it yourself
Keep the fast and slow lengths, quantity, and costs unchanged. Run one version with stop/target distances of 100/200, then one with 200/400. Check what happens after the same entry signal.
Solution
In Inputs, change only Stop distance (ticks) and Target distance (ticks). With larger distances, the position may close on a different candle or for a different reason.
The crossing-based close remains in both versions. A more distant target therefore does not mean the position must stay open until it reaches it. The closing rules work together.
After saving inputs, always wait for recalculation and then read the new result. Keep the two exports under different names if you want to compare them later.
Find the reason for an exit
Select a closed trade and check its entry price, specified tick distances, and exit candle’s OHLC values. Use the exit price and time to determine which rule explains the trade. If the candle touches several levels, take the fill model into account too.