Your first strategy
Turn crossing signals into entry and exit rules for a backtest.
In the chapter on crossings, the indicator drew a marker where the averages crossed. Now you use the same event to trigger a simulated order. The program opens a long position at an upward crossing and closes it at a downward crossing.
What does a strategy do?
An indicator calculates and displays. A strategy also sends orders to the backtest simulator. The simulator tracks orders, positions, and results based on historical candles and the specified rules.
This testing on historical data is called a backtest. Every order in this chapter is simulated; starting Run Pyne code does not submit orders to a real trading account.
A position is the holding that exists after an entry has filled. An order is the instruction; a fill is the event that creates or changes the position. We do not use these three terms interchangeably.
Write the rules in words first
This strategy’s rules are:
- Calculate length-five and length-twenty SMAs on every candle.
- At an upward crossing, submit an entry order for a one-unit long position.
- At a downward crossing, close the position associated with the entry identified as
Long. - Perform calculations using closed historical candles.
A long position increases in value when the price rises and decreases when it falls. We do not open short positions in this example.
The rule does not claim that every upward crossing is profitable. The backtest examines what would have happened with these actions on the given data.
The complete program
Create crossover_strategy.py:
"""
@pyne edge
"""
from pynecore.lib import close, color, input, plot, script, strategy, ta


@script.strategy(
    "Average Crossing Strategy",
    overlay=True,
    initial_capital=10000,
    default_qty_type=strategy.fixed,
    default_qty_value=1,
    pyramiding=1,
)
def main(
    fast_length: int = input.int(5, title="Fast length", minval=1, maxval=200),
    slow_length: int = input.int(20, title="Slow length", minval=1, maxval=200),
):
    fast_average = ta.sma(close, fast_length)
    slow_average = ta.sma(close, slow_length)
    crosses_up = ta.crossover(fast_average, slow_average)
    crosses_down = ta.crossunder(fast_average, slow_average)
    if crosses_up:
        strategy.entry("Long", strategy.long)
    if crosses_down:
        strategy.close("Long")
    plot(fast_average, "Fast average", color=color.blue, linewidth=2)
    plot(slow_average, "Slow average", color=color.orange, linewidth=2)
@script.strategy marks main() as a strategy. The calculations and the two lines can still be used as before. The new import is the strategy namespace, which contains order operations and strategy data.
The decorator is a multiline call. Its settings control how the strategy runs; the parameters of main() are inputs for our own calculations.
Initial capital and quantity
initial_capital=10000 sets the simulation’s starting balance. The demo data’s market metadata determines the units and price levels used for the run.
default_qty_type=strategy.fixed means a fixed quantity. default_qty_value=1 requests an order for one unit. This is not one percent of capital and is not necessarily one unit of currency.
pyramiding=1 allows at most one entry in the same direction. The example does not add more long entries to an existing position.
While learning, we follow the operations with a small, fixed quantity. This leaves fewer different sizing factors to examine at once when results change.
Entry and close identifiers
The first argument in strategy.entry("Long", strategy.long) is an order identifier. The program chooses the text Long; the second argument sets the direction.
strategy.close("Long") refers to that same identifier. The names must match. If you enter with the identifier "Buy", closing "Long" does not target that entry.
The downward crossing closes a position here; it is not a short entry. If there is no open position associated with that name, there is nothing to close.
Run it in PyneIDE
- Save the complete program.
- Choose Run Pyne code and the
demodata. - Check the two SMA lines and trade markers on the chart.
- Expand the panel below the chart and select Trades.
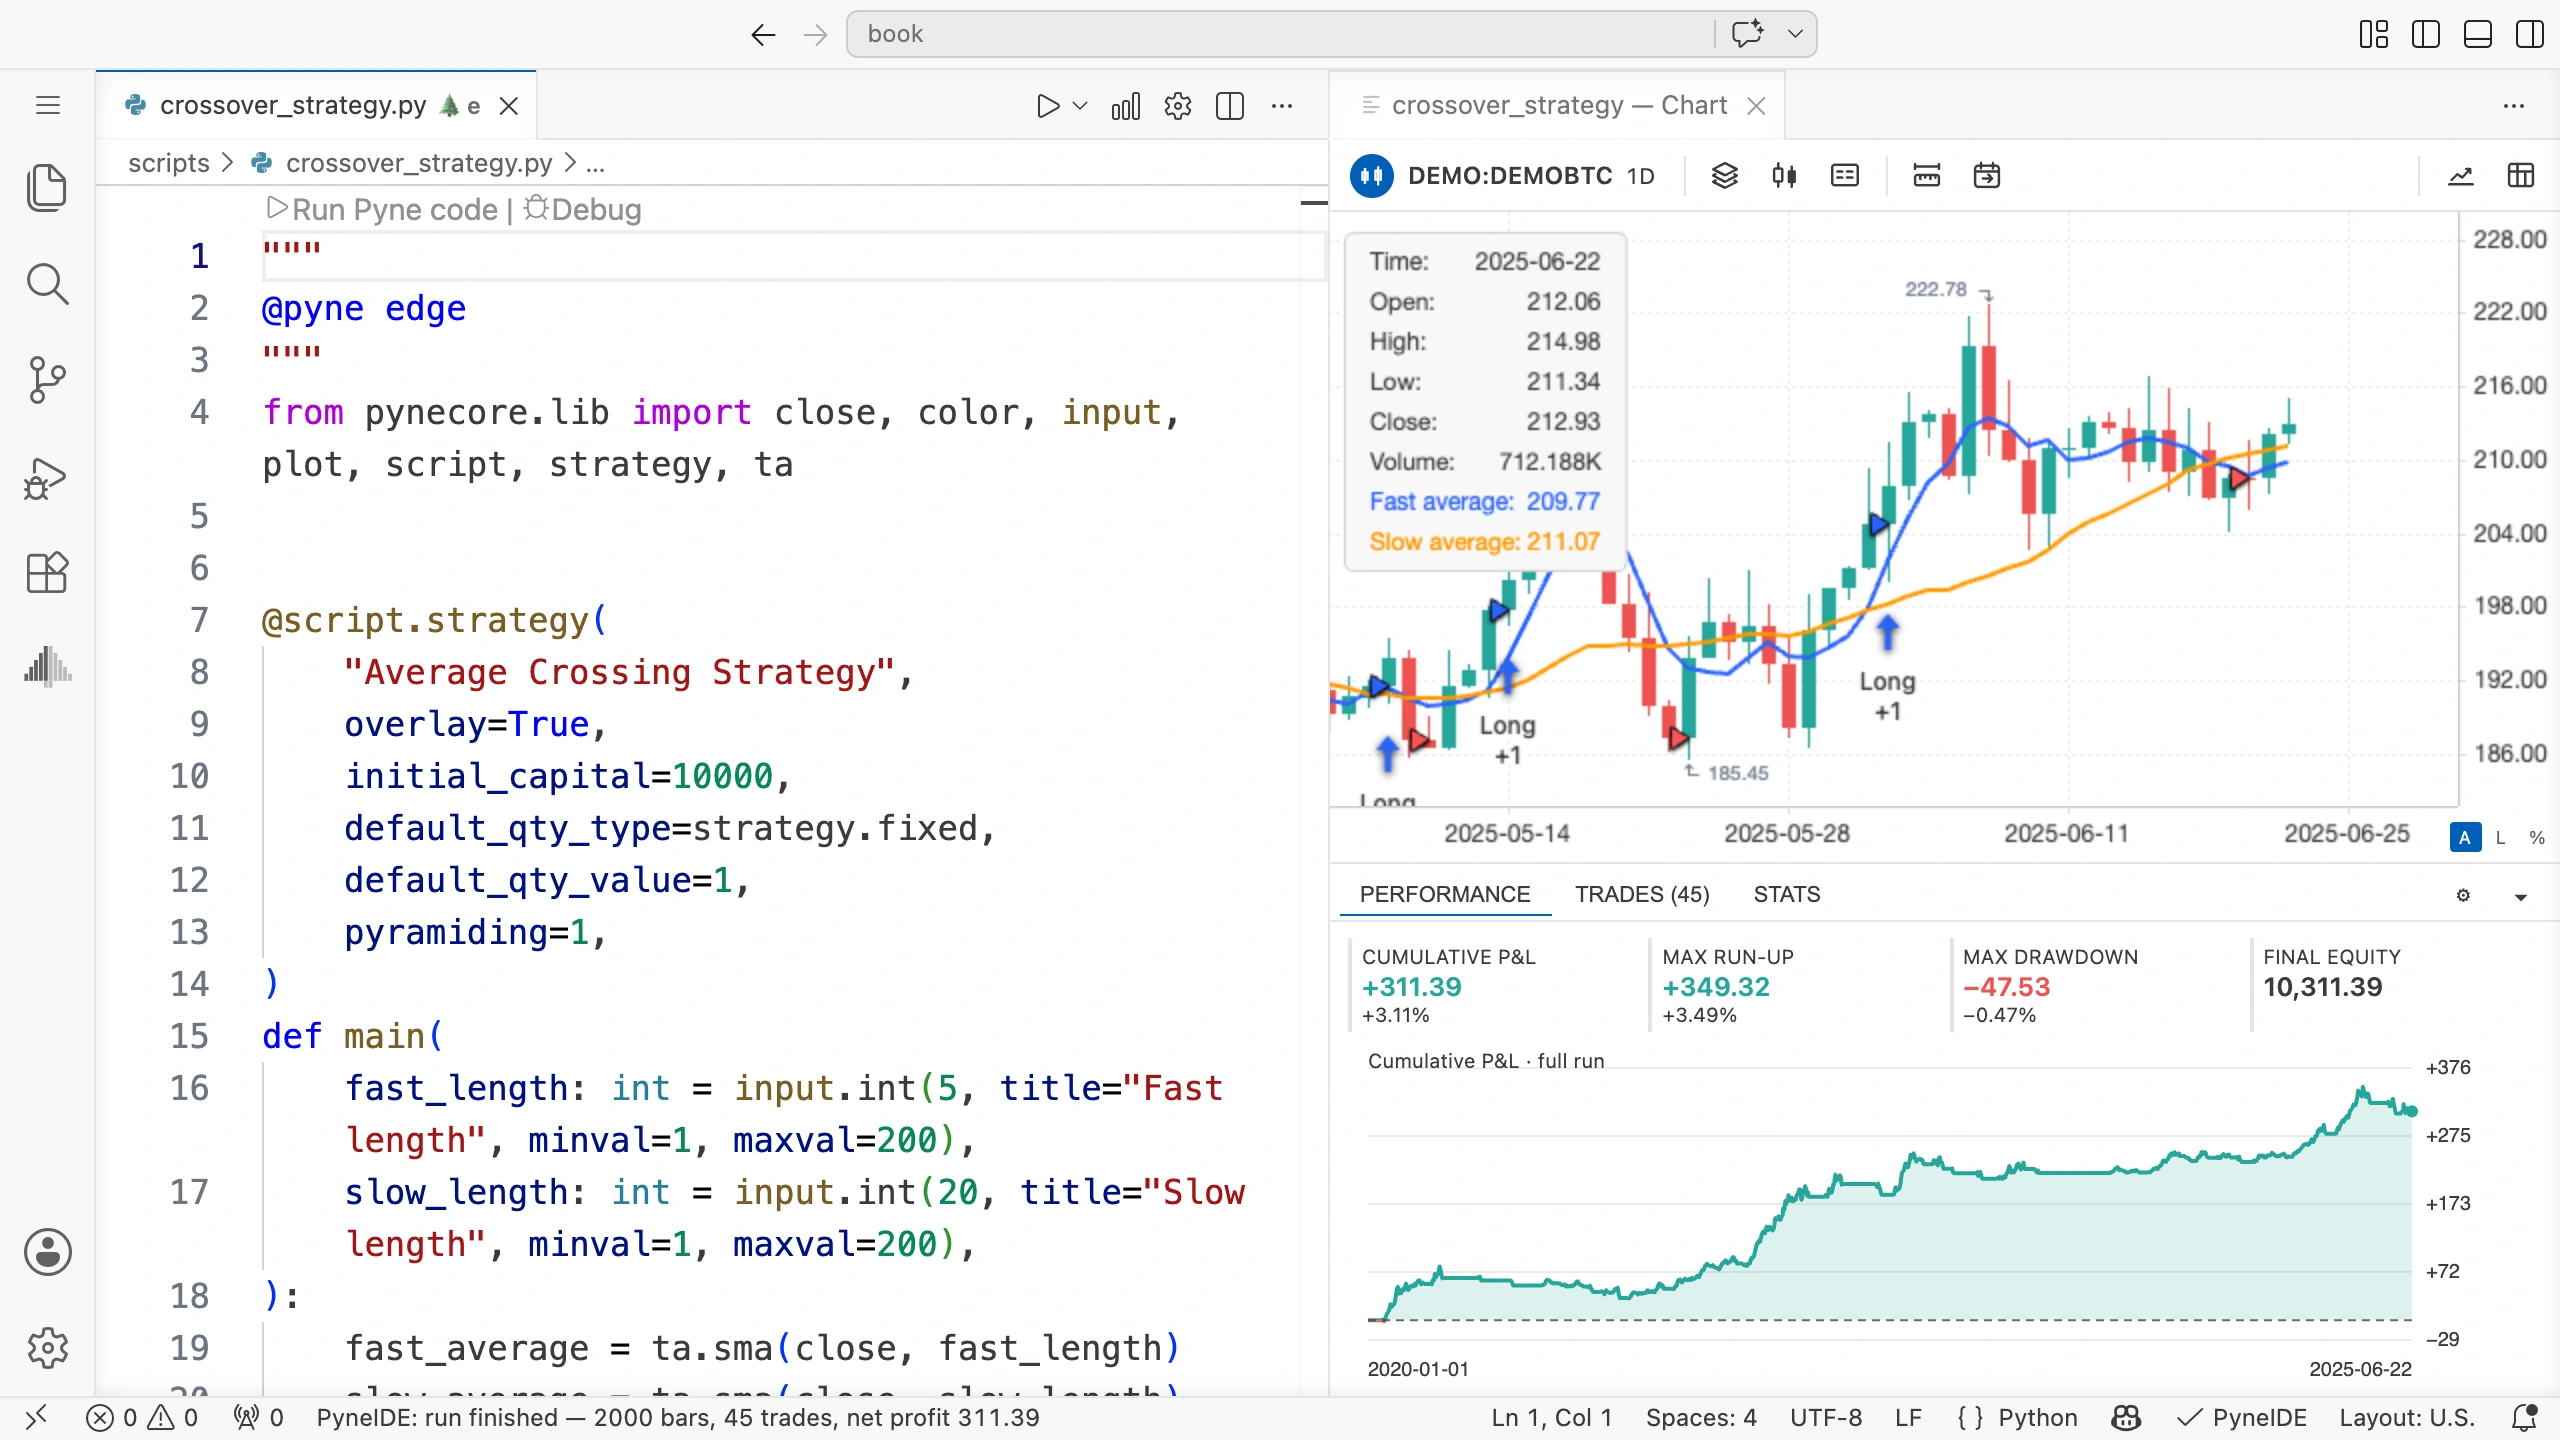
If no trades appear, check that you ran the strategy file and kept the @script.strategy marker. Also check the actual values of both inputs. SMAs with equal lengths calculated from the same source do not cross each other.
Signal time and fill time
With the defaults used here, the program submits a market order based on the candle’s closing data. The order usually fills at the next candle’s open. The signal candle and entry candle can therefore differ.
The same applies to a market close. A closing order created at the downward crossing can close the position at the next open.
If the last candle generates a new order, the file has no following candle. That order may therefore remain unfilled. A position opened earlier can also remain open at the end of the data.
The fill behavior is a setting. We look at it in Properties in the next chapter too. Always interpret a result using the fill behavior under which it was produced.
Try it yourself
Open the strategy’s inputs and set both the fast and slow lengths to 20. Predict two things: how the two lines will sit relative to each other, and how many crossings can trigger trades.
Solution
The two SMAs use the same window size and the same prices, so they match. There is no candle where one moves above or below the other. This strategy rule opens no trades.
The existing chart shows that result only after you save the modified inputs and recalculation finishes. After checking, restore the values 5 and 20.
Select an entry
Find a filled entry and examine the two averages on the preceding candle. The upward-crossing condition must be met on the signal candle. Compare the trade price with the entry candle’s opening price rather than automatically with the signal candle’s closing price.